
1X2 Football Correct Score From AI Software
Quick Answer
Read original AI football software screenshots for Manchester United–Tottenham and Ajax–Nijmegen, comparing 1X2 outcomes and correct-score estimates.
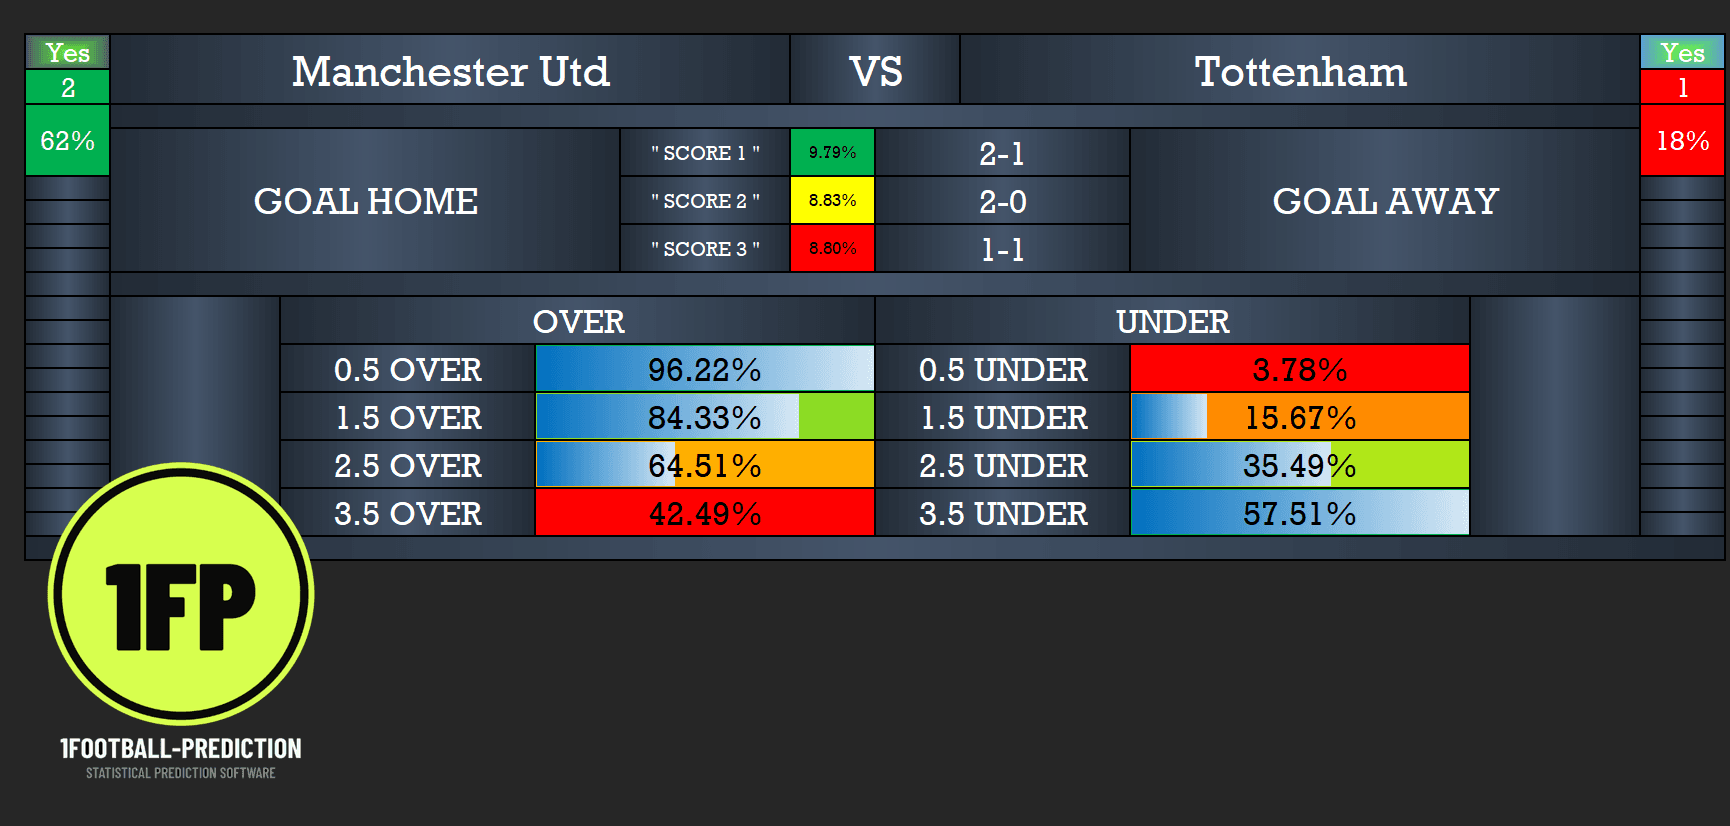
Original software screenshot supplied by 1Football Prediction. The three listed scores are model estimates.
Football prediction software can help you compare a home win, draw or away win with individual correct-score possibilities. The useful part is reading those estimates together: a leading scoreline is only one possible outcome, and a lower-ranked forecast can still match the result.
Our original screenshots show how this works for Manchester United versus Tottenham and Ajax versus Nijmegen. In both examples, 1–1 appears third in the software’s score list, and the accompanying result card also displays 1–1. Here is what the screens show, how to interpret them, and what these examples can tell you.
What is the difference between 1X2 and correct score?
The 1X2 market describes the match outcome:
- 1: the home team wins.
- X: the match ends in a draw.
- 2: the away team wins.
Correct score is more specific: it requires the exact number of goals for each team. A 1–1 result belongs to the X category, but so do 0–0, 2–2 and other draws. A forecast of 2–1 belongs to the home-win category.
This distinction matters when reading AI football predictions. The probability of one exact score is not the probability of its entire 1X2 category. You cannot calculate the complete draw probability simply by adding the draws visible in a three-score shortlist; other possible draws are missing.
For a fuller introduction, read our guide to 1X2 versus correct-score predictions.
Manchester United vs Tottenham: reading the three forecasts
The Manchester United–Tottenham screen lists:
| Position | Correct score | Displayed estimate | 1X2 category |
|---|---|---|---|
| Score 1 | 2–1 | 9.79% | Home win |
| Score 2 | 2–0 | 8.83% | Home win |
| Score 3 | 1–1 | 8.80% | Draw |
The first score has the highest displayed probability, but the difference between 2–1 and 1–1 is only 0.99 percentage points. A reader who looks only at the first row misses how close these individual estimates are.
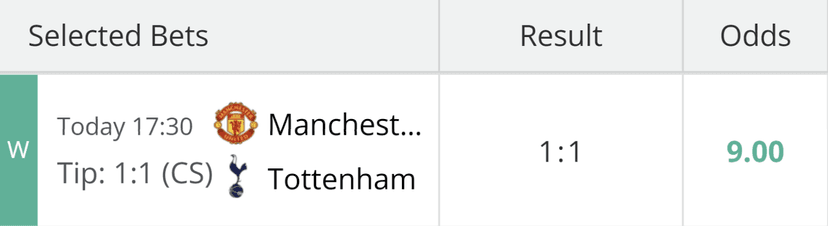
The supplied result card displays a 1–1 tip and result, with odds of 9.00. These are the figures shown in the image, not a current price quotation.
The 1–1 shown on the result card matches Score 3. The first two scorelines do not match that displayed result. This is an example of a matching outcome within a shortlist, rather than a successful first-choice score prediction.
Ajax vs Nijmegen: another third-ranked 1–1
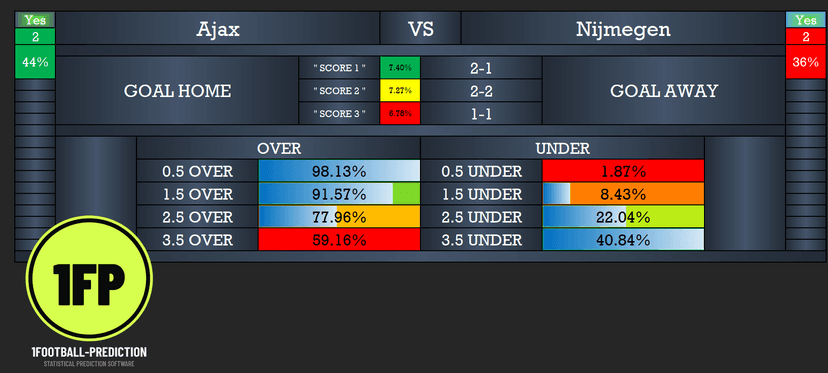
Original Ajax–Nijmegen software screenshot, including the score shortlist and goals estimates.
The Ajax–Nijmegen screen offers a different balance of possibilities:
| Position | Correct score | Displayed estimate | 1X2 category |
|---|---|---|---|
| Score 1 | 2–1 | 7.40% | Home win |
| Score 2 | 2–2 | 7.27% | Draw |
| Score 3 | 1–1 | 6.78% | Draw |
Here, two of the three listed scores are draws. That does not establish that a draw is the most likely overall match outcome: a complete 1X2 estimate must account for all relevant scorelines, not just count the entries in this shortlist.
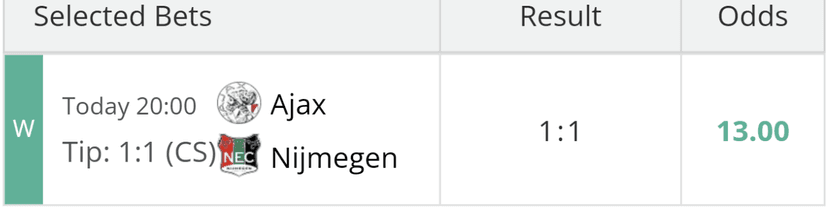
The supplied Ajax–Nijmegen result card displays 1–1 and odds of 13.00. The matching software forecast is the third listed score.
Again, the displayed result matches Score 3. The gap between the leading 2–1 forecast and 1–1 is 0.62 percentage points. These figures show why it is useful to examine the probabilities alongside the ranking.
Use the goals table as additional context
Both software screens also include over/under estimates. Manchester United–Tottenham shows 64.51% for over 2.5 goals, while Ajax–Nijmegen shows 77.96%.
A 1–1 result contains two goals, so the results on the supplied cards fall under 2.5. This illustrates an important point: one listed correct score can match the result while a different market’s more likely outcome does not occur. A probability estimate still leaves room for other outcomes.
The percentages in these screenshots describe the model’s output. They are not measured accuracy rates.
How to review AI correct-score predictions
- Check the fixture and team order. A 2–1 prediction means two goals for the home team and one for the away team.
- Read every score and percentage. Compare the size of the differences rather than treating the first row as a certainty.
- Keep the markets separate. A correct-score shortlist, a full 1X2 forecast and a goals estimate answer different questions.
- Save the prediction before kick-off. Keep a dated record of the output and the selection rule you intend to assess.
- Record every outcome. Track misses as well as matches, and assess the first-choice score separately from the full shortlist.
These two pairs of screenshots are selected examples. They do not establish a long-term hit rate or profit. The images alone also do not verify when the forecasts were generated, whether a bet was placed, or whether the displayed odds were available beforehand. The cards show “Today” rather than a complete fixture date, so they are presented here as supplied screen examples rather than independently dated match reports.
Explore the correct-score software
If you want to compare score scenarios with other match estimates, our Correct Score Football Software — ScoreCaster Pro provides three correct-score scenarios alongside goals, 1X2 and both-teams-to-score estimates. The product runs in Microsoft Excel on Windows, with 12 months of access as described on the product page.
Use the original examples above to understand the format before choosing the tool. The practical lesson is to read the whole forecast, understand its uncertainty and keep a complete record of how it performs.
18+. Predictions are estimates, not guaranteed results. Only risk money you can afford to lose.