Live
AI football software for correct scoreOver 2.5 goals tipsBTTS tipsCorners tipsLive goals tipsFree football predictions updated dailyAI football software for correct scoreOver 2.5 goals tipsBTTS tipsCorners tipsLive goals tipsFree football predictions updated daily
26 July 2026

How to Get 1x2 Correct Score Predictions from AI Software

How to Get Correct Score Predictions from AI Software

How to Get 1x2 Correct Score Predictions from AI Software

18+. Everything below describes statistical model output. Probabilities are not guarantees and no software can tell you the result of a match. Only stake what you can afford to lose. Free confidential support: BeGambleAware.org

Correct score is the hardest football market to model. Predicting that a team will win is one problem. Predicting the exact scoreline is a different one, because a single match can end in dozens of plausible results and the probability has to be shared out across all of them.

That is precisely why software helps. A model does not need to be certain about one scoreline. It needs to rank every scoreline by likelihood and show you where the probability actually sits. This guide covers how correct score prediction software produces those numbers, how to run one, and how to read what comes out.

What a correct score prediction really is A correct score prediction is not a claim that a match will finish 3-1. It is an estimate of how likely each scoreline is, given the data behind the model.

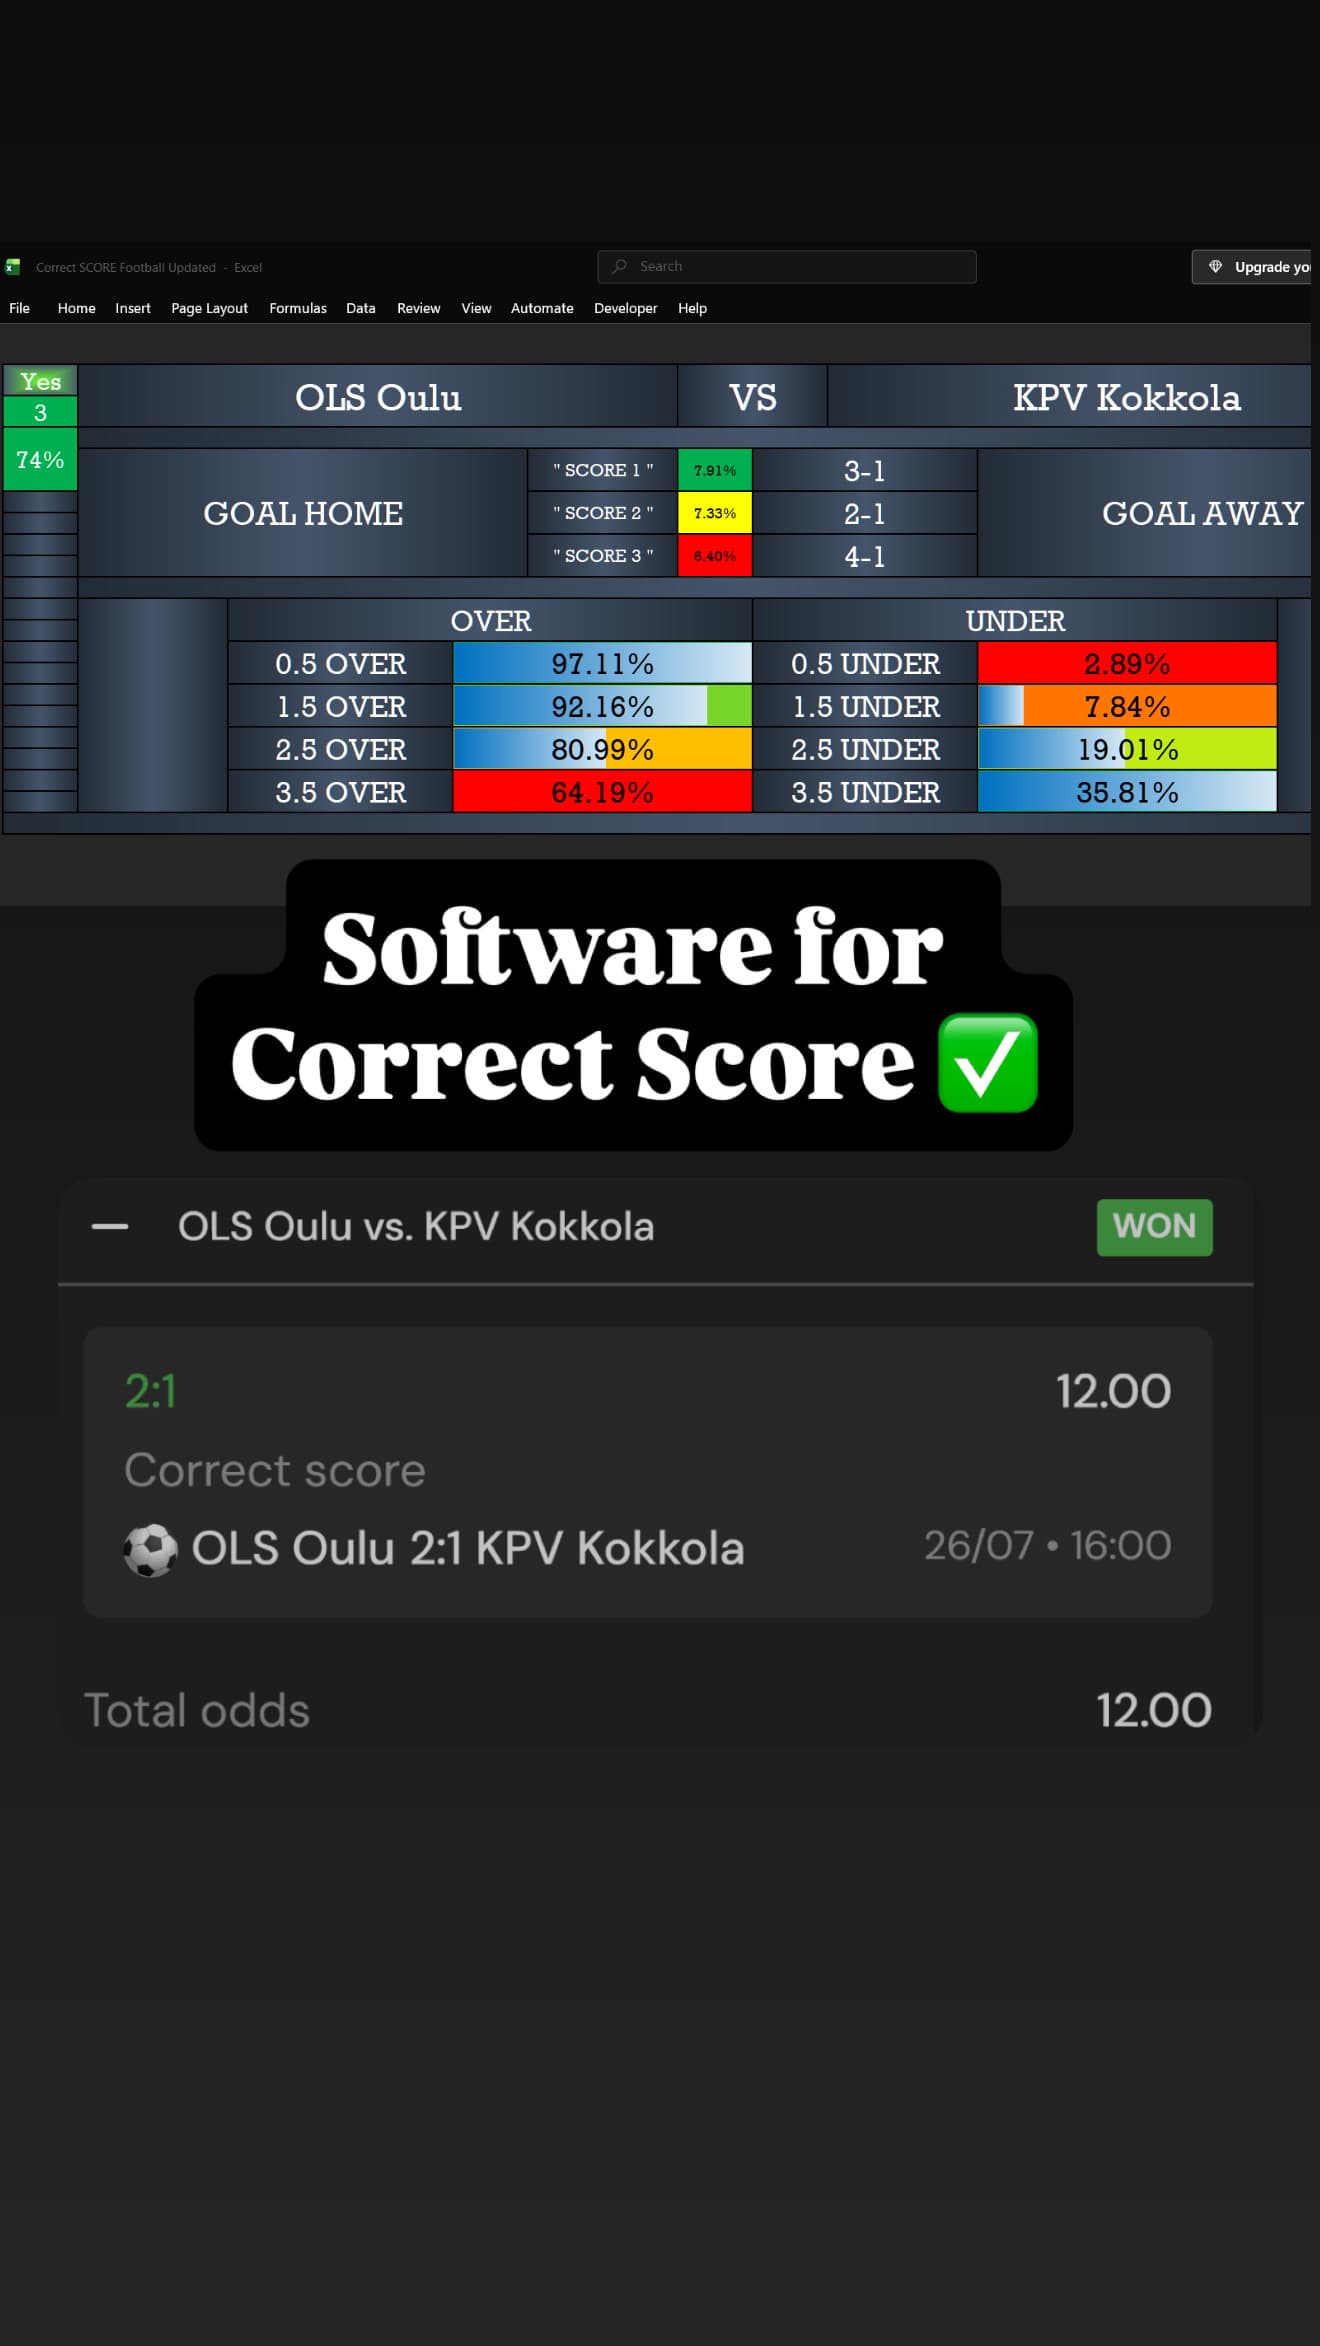
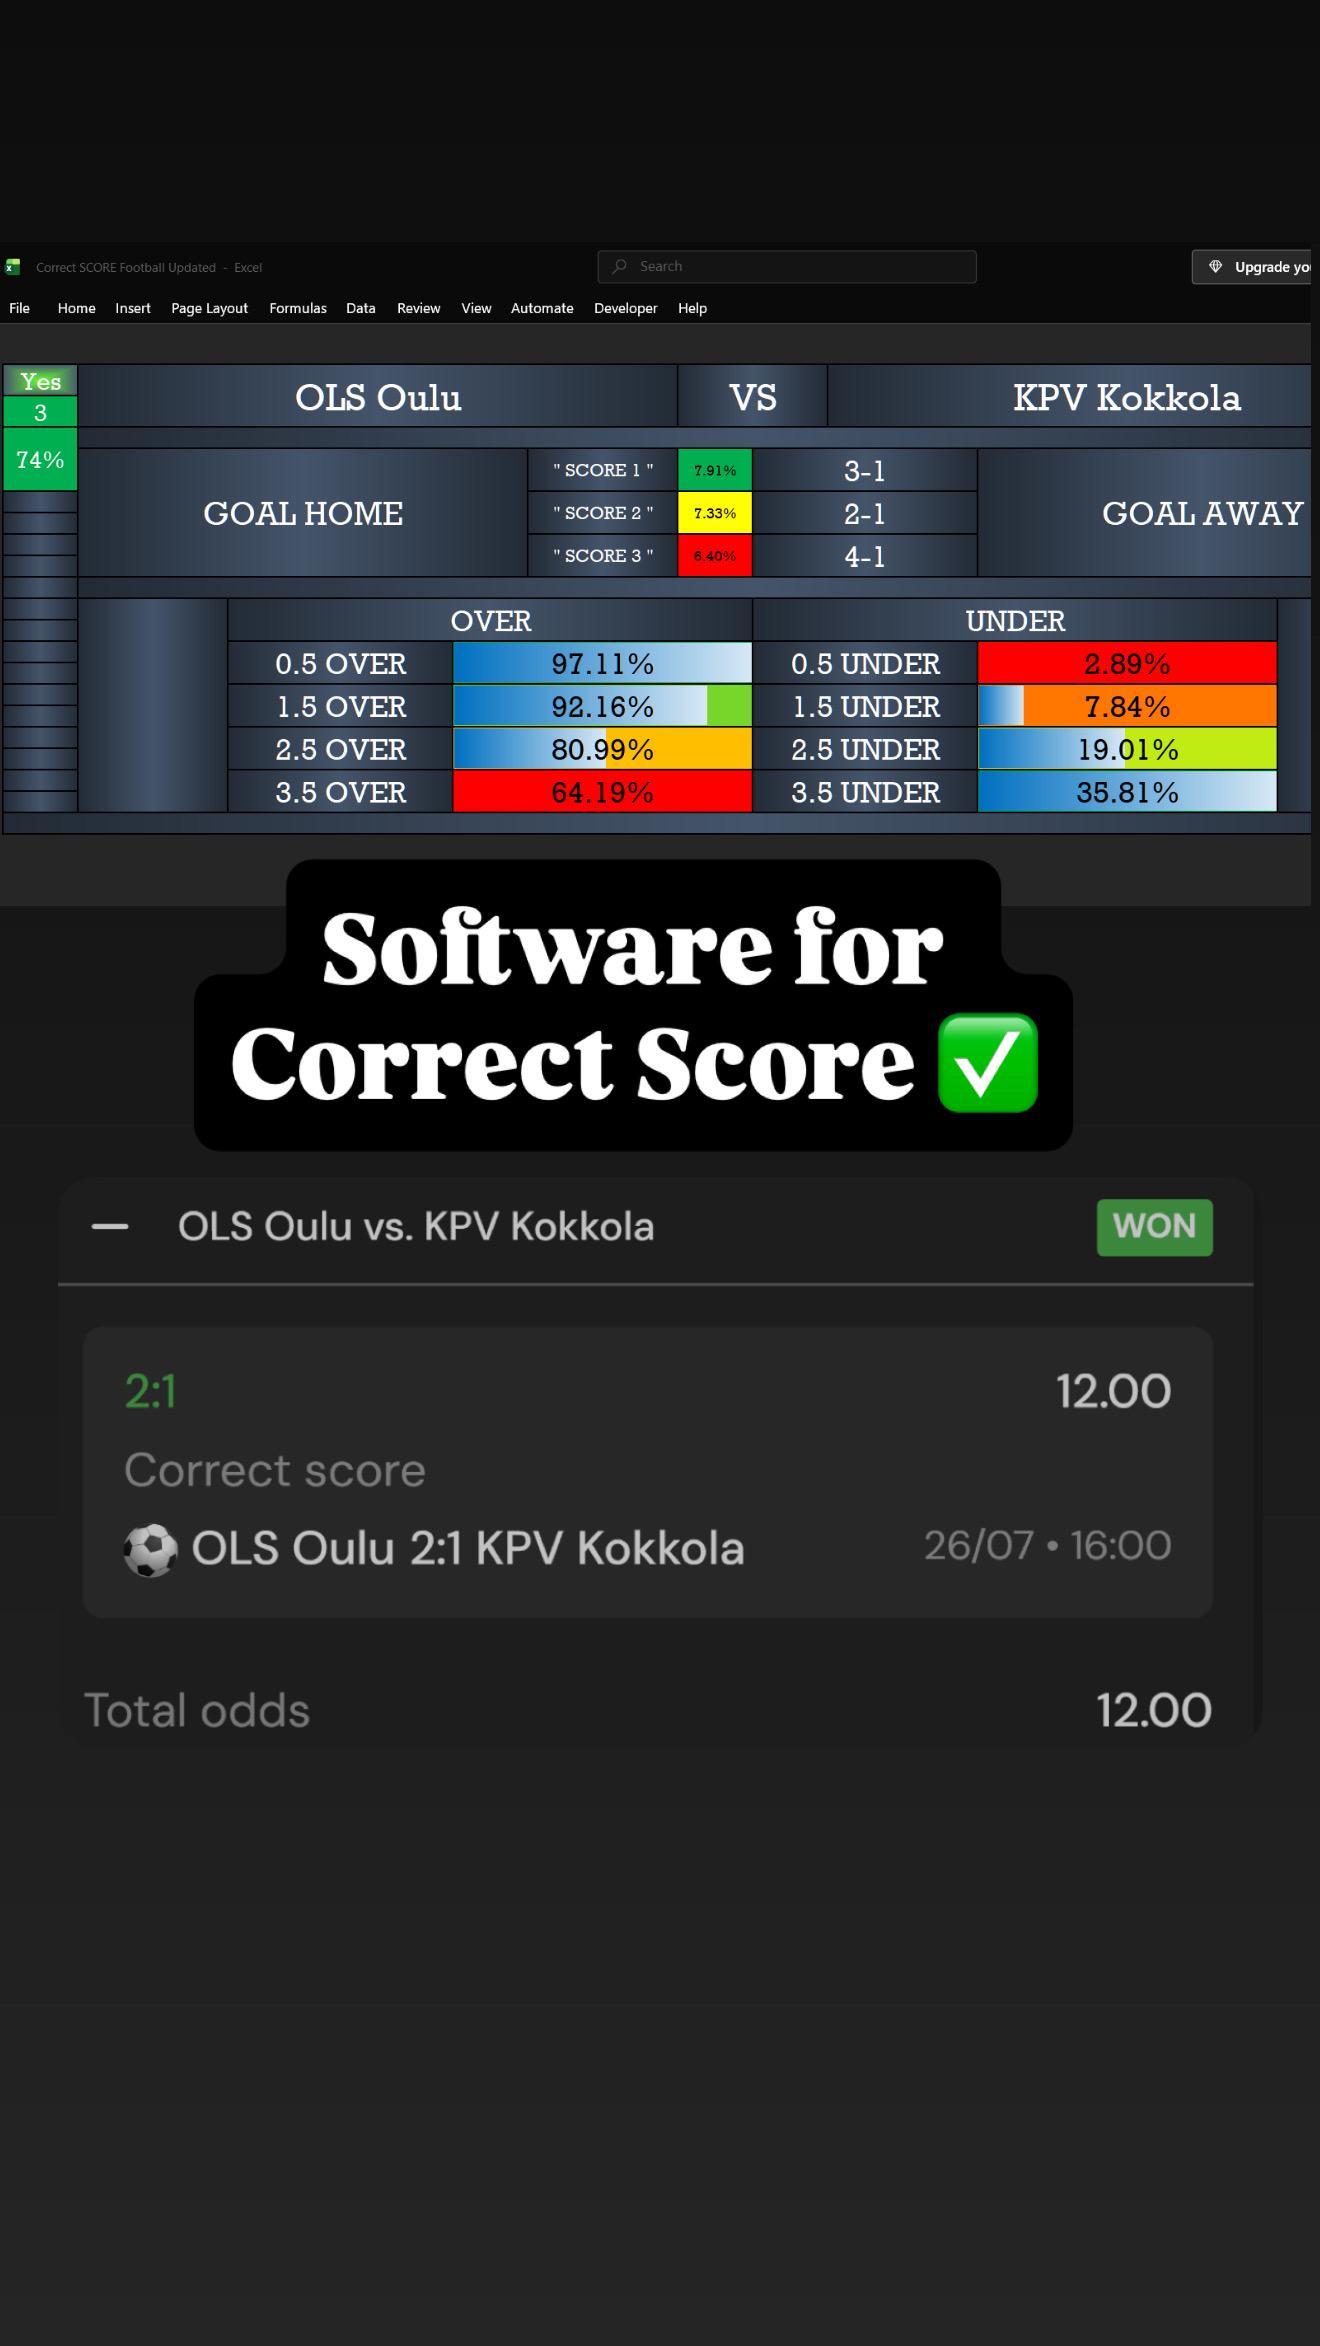
If a model shows 3-1 at 7.9%, it is saying that across a large number of matches with a similar statistical profile, roughly eight in a hundred finished 3-1. That is a distribution, not a forecast of one result.

The number that matters A well built correct score model will see its own top ranked scoreline fail far more often than it lands. That is not a flaw. No single exact scoreline in football carries a high probability, and any tool implying otherwise is describing something other than football.

Why this market is harder than the others Match result has three outcomes. Over and under has two. Correct score has a long tail, and the model has to answer several questions at once before it can rank anything.

How many goals is the home side likely to score? How many is the away side likely to score? Are those two numbers independent, or do they pull on each other? How much does home advantage shift the distribution in this competition? How heavily should a match from eighteen months ago count against one from last week? Most statistical approaches build on a Poisson goal distribution. Raw Poisson has a known weakness: it misprices the low scoring results, particularly 0-0, 1-0, 0-1 and 1-1. The standard correction comes from Dixon and Coles (1997), published in the Journal of the Royal Statistical Society, Series C, which shifts probability between those four scorelines and adds a time weighting so recent form counts for more. Most serious football models in use today are descendants of that paper or of Maher (1982) before it.

How the software builds the prediction Tools differ in the details, but the pipeline is broadly the same one described on our model overview.

Data collection The model needs consistent historical match data: goals for and against, home and away splits, competition, and ideally shot quality data such as expected goals. Our tools pull from a licensed feed via football-data.org, which matters more than people expect. Inconsistent data is the single largest source of unstable output.

Team strength estimation Each team gets an attacking rating and a defensive rating, expressed relative to the league average. A side that consistently outscores expectation at home carries a stronger home attack coefficient.

Goal expectancy The model combines home attack, away defence and a home advantage factor into an expected goals figure for each side. Everything downstream inherits this number, so it is the first thing worth sanity checking.

The scoreline grid From those two figures the software calculates a probability for every scoreline up to a sensible cutoff. That grid is the actual prediction. The ranked top three you see on screen is just the three brightest cells in it.

Worked example · illustrative

Scoreline grid at 3.10 expected home goals, 1.30 away

HOME ↓ / AWAY → 0 1 2 3 4 0 1.23 1.60 1.04 0.45 0.15 1 3.81 4.95 3.22 1.39 0.45 2 5.90 7.67 4.98 2.16 0.70 3 6.10 7.92 5.15 2.23 0.73 4 4.72 6.14 3.99 1.73 0.56 5 2.93 3.81 2.48 1.07 0.35 higher probability mid lower values are % · grid shown covers about 90% of all outcomes Read the grid rather than the top line and the shape of the match becomes obvious. The probability is not concentrated on one cell, it is smeared across a cluster of home wins by one or two goals. That cluster is the prediction. Any individual cell in it is a coin toss with long odds.

Derived markets Once the grid exists, every other goals market falls out of it by adding up cells. Over and under lines, both teams to score, and the 1X2 result all come from the same calculation, which is why the numbers on a good tool never contradict each other.

Same match · totals derived from the grid

Goals markets

Over 0.5 98.8% Over 1.5 93.4% Over 2.5 81.5% Over 3.5 64.1% Under 2.5 18.5% Under 3.5 35.9% Derived by summing the scoreline grid. Figures are model probabilities, not expected returns. Running a prediction, step by step Select the fixture Choose home and away from the league dropdowns. Both sides need to sit in the same league dataset, otherwise the strength ratings are not on a comparable scale and the output is meaningless.

Refresh the data Update the feed before you run anything. Stale form data is the most common cause of a prediction that looks obviously wrong, and it is the easiest thing to fix.

Check goal expectancy first Before looking at a single scoreline, read the expected goals for each side. If those two numbers do not match what you know about the fixture, something upstream has gone wrong and every scoreline below will inherit the error.

Read the ranked scorelines as a cluster The tool lists the most likely results with a percentage against each. When the top three sit close together, as in the example above, that closeness is the message: the model sees no standout scoreline and expects a range of similar results.

Cross check the goals markets The totals should agree with the scorelines, because they come from the same grid. If they appear to disagree, you are reading two different runs or the data refreshed halfway through.

Compare against the market Turn bookmaker odds into implied probability by dividing 100 by the decimal price. Odds of 12.00 imply roughly 8.3%. Comparing that against the model figure shows you where the two views diverge. Divergence is not evidence the model is right. It is a prompt to work out why they differ.

Three habits that stop you misreading the output Treat percentages as ranges. A 7.9% output is not meaningfully different from 7.4% or 8.3%. Model precision is always narrower than model accuracy, and the decimal places are there for sorting, not for confidence.

Judge over a sample, never a match. One correct prediction proves nothing and one miss proves nothing. What you are testing is calibration: whether the outcomes a model calls 8% land close to 8% of the time across hundreds of fixtures. That is the only honest measure in this market, and it is why we publish a running record of graded predictions rather than a headline percentage.

A probability is not a plan. The model's job is to describe likelihood. What you do with that is your decision, and it needs to account for the fact that correct score probabilities are low by their nature.

Common mistakes Running a fixture with too little history behind it, such as an early season match involving a newly promoted side. Ignoring team news. Most statistical models have no lineup information, so a missing first choice striker is completely invisible to them. Picking the scoreline you already believed in and treating the model as confirmation. Comparing tools that define the market differently. Some include extra time in cup ties, most do not. Reading a single decimal place as meaningful. It is not. Frequently asked questions Can AI predict the correct score of a football match? How accurate is correct score prediction software? What data does the software need? Do I need to understand the maths? Does the same model work across every league? What do I actually get when I buy the software? Where to go next Software Correct Score Football Software Software AI Football for Correct Score Goals markets Just Goals V5 Free Today's predictions, no signup Setup How to install and run the tools All tools Browse the full store Sources and further reading Dixon, M. J. and Coles, S. G. (1997). Modelling association football scores and inefficiencies in the football betting market. Journal of the Royal Statistical Society: Series C (Applied Statistics), 46(2), 265 to 280. doi.org/10.1111/1467-9876.00065 Maher, M. J. (1982). Modelling association football scores. Statistica Neerlandica, 36(3). The original Poisson attack and defence formulation. football-data.org. The licensed fixture and results feed behind our daily model runs. BeGambleAware and GamCare. Free, confidential support in the UK. UK Gambling Commission. Licensing and consumer guidance. 18+ · This article is informational. All figures shown are statistical model outputs, illustrative of how the software presents probability, and are not guarantees of any outcome or of any return. Betting involves risk of loss.

If gambling is affecting you or someone you know, free confidential support is available from BeGambleAware.org and the National Gambling Helpline on 0808 8020 133, open 24 hours.

← Back to news