
Football Software for Daily Correct Score Prediction
Explore football software for daily correct score prediction with original Fiorentina–Napoli screenshots, score probabilities and a practical review workflow.
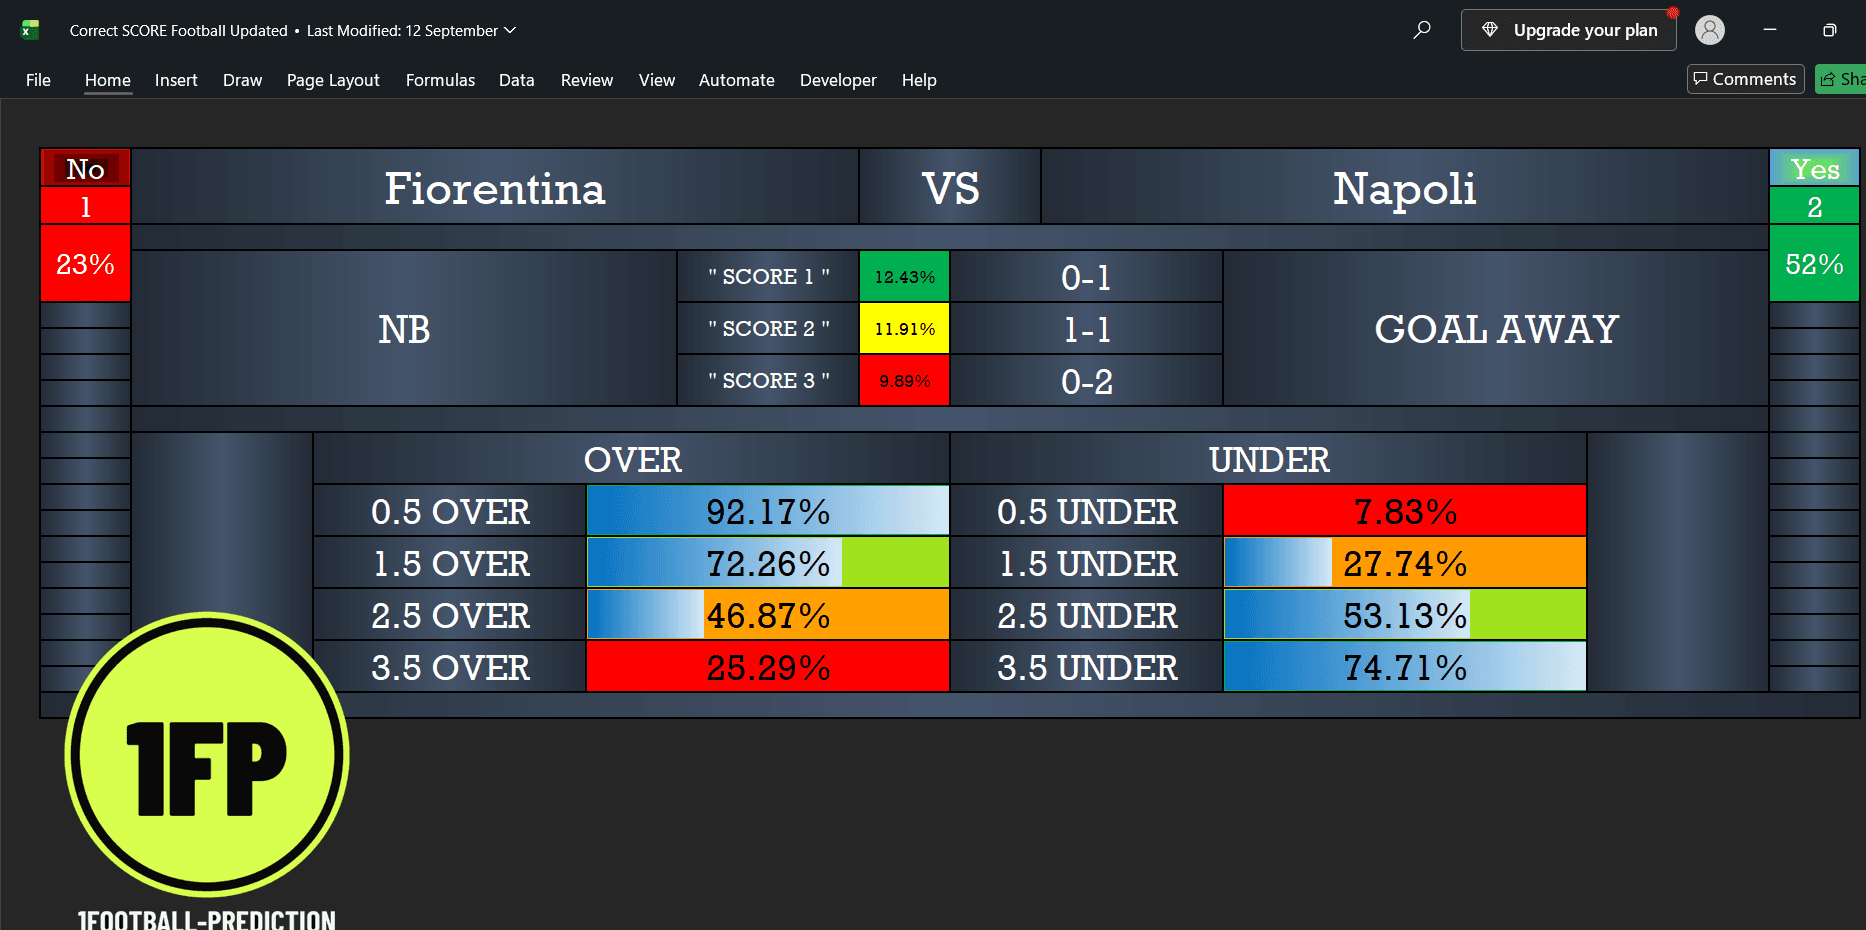
Original supplied software screenshot, unchanged. The displayed probabilities are estimates; the image does not establish when this forecast was generated.
Daily software workflow · Fiorentina vs Napoli
Football software for daily correct score prediction helps you organise possible scorelines and compare their estimated probabilities. Its value is in making the numbers easier to examine consistently: which score ranks first, how close the alternatives are, and whether the goals estimates tell a similar story.
The original Fiorentina–Napoli workbook screenshot above is a useful example. It ranks 0–1 first at 12.43%, followed closely by 1–1 at 11.91%. The separate result image supplied for this article displays a 1–1 draw. That makes this a lesson in reading the whole output rather than treating the first score as the only possible outcome.
The main takeaway: The second listed score matches the supplied result, but the first does not. A daily evaluation should keep those two facts separate and use the same selection rule for every match.
Fiorentina vs Napoli: reading the daily output
The score order is home team first, away team second. In this example, 0–1 means a Napoli win; 1–1 means a draw; and 0–2 means a two-goal Napoli win.
| Software entry | Scoreline | Displayed probability | Against the supplied 1–1 result |
|---|---|---|---|
| Score 1 | 0–1 | 12.43% | Does not match |
| Score 2 | 1–1 | 11.91% | Matches |
| Score 3 | 0–2 | 9.89% | Does not match |
The gap between the first two estimates is only 0.52 percentage points. Although the software places an away win first, the draw is a close alternative within this shortlist.
Together, these three distinct scorelines total 34.23%. If they come from one complete probability distribution, 65.77% remains for all other scores. The list is a selection of scenarios, not a guarantee that one of those three must happen.
The original Fiorentina–Napoli result image

Original supplied screenshot, reproduced without alterations. The image shows Fiorentina 1–1 Napoli and the status “Finished”.
Napoli's official fixture announcement confirms the match on 20 September 2026 at the Artemio Franchi, with a 12:30 local kick-off. The result image displays 11:30 without identifying its timezone. The final-score comparison in this article uses the supplied image; the official source linked here confirms the fixture, not the final result.
The software image does not show when this individual forecast was generated. Its workbook-level “Last Modified: 12 September” label does not establish a pre-match forecast timestamp. These images support a retrospective explanation of the displayed output, rather than independent proof of advance publication.
What the goals table tells you about a 1–1 draw
A 1–1 score contains exactly two goals. The screenshot's goals estimates provide a second way to examine that outcome.
| Goal threshold | Over estimate | Under estimate | What the displayed 1–1 result means |
|---|---|---|---|
| 0.5 | 92.17% | 7.83% | Over |
| 1.5 | 72.26% | 27.74% | Over |
| 2.5 | 46.87% | 53.13% | Under |
| 3.5 | 25.29% | 74.71% | Under |
The larger estimate at each of these four thresholds aligns with the two-goal result shown. However, these are related descriptions of the same match, not four independent demonstrations of accuracy.
If the totals use one consistent distribution, the estimated probability of exactly two goals is the over-1.5 estimate minus the over-2.5 estimate: 72.26% − 46.87% = 25.39%. That includes 2–0, 1–1 and 0–2. It should not be confused with the narrower 11.91% assigned specifically to 1–1.
This distinction is useful when reviewing daily software: a model can identify a plausible goal total without selecting the exact home-and-away allocation as its first choice.
Build a consistent daily correct score routine
Before the match: save a complete record
Check the fixture, home/away order and date. Save the software version, refresh time, all displayed scores and their probabilities. If you review team news separately, record the source rather than assuming it is an input to the software.
Choose your evaluation rule in advance. For example, “first displayed score” and “result appears anywhere in the three-score shortlist” are different measures. In this example, the first measure misses and the second matches. Do not switch between them after seeing the result.
After the match: compare without rewriting the forecast
Record the final score and a result source alongside the saved output. Retain the original probabilities and include misses, postponed games and unresolved fixtures. A daily log should cover all eligible forecasts under the chosen rule, not only examples selected because they matched.
Over time: assess more than isolated matches
A single 1–1 example cannot establish a long-term hit rate or profit. Review a defined period and sample, distinguish top-score accuracy from shortlist coverage, and check whether estimated probabilities are consistent with observed frequencies across a sufficiently large record.
Choose software with an output you can inspect
For a practical daily workflow, look for readable score estimates, clear platform requirements and an output you can retain for later comparison. The Correct Score Football Software product page describes the Windows and Microsoft Excel setup, three score forecasts per match and goals-market coverage.
Explore the daily correct score tool
Review features, compatibility and access details, and compare them with the original workbook screenshot in this article.
Compare a different score pattern
The Celtic–Rangers walkthrough explains a third-ranked score and shows why matching one scenario does not mean every market was correct.
The site's free predictions and public track record belong to a separate website model. Its record should not be presented as the paid workbook's performance.
Common questions
Does daily prediction software guarantee a correct score every day?
No. Daily availability describes a workflow or update frequency, not a guarantee of a daily winning score.
Was 1–1 the highest-ranked score for Fiorentina–Napoli?
No. It was second at 11.91%. The leading 0–1 estimate was 12.43%, only 0.52 percentage points higher.
Can I treat the goals estimates as the probability of 1–1?
No. Goal totals combine several scorelines. The screenshot assigns 11.91% to 1–1, while the calculated 25.39% for exactly two goals includes other two-goal scores.
Prepared by 1Football Prediction with AI assistance, using the two original supplied screenshots and the linked official fixture announcement. This is an educational example, not an independent performance test.
18+. Predictions are estimates, not guarantees. Support for gambling-related harm.