How to Get Football Correct Score
Learn how to read football correct score probabilities using original Celtic vs Rangers screenshots, a score comparison and clear limits of one example.
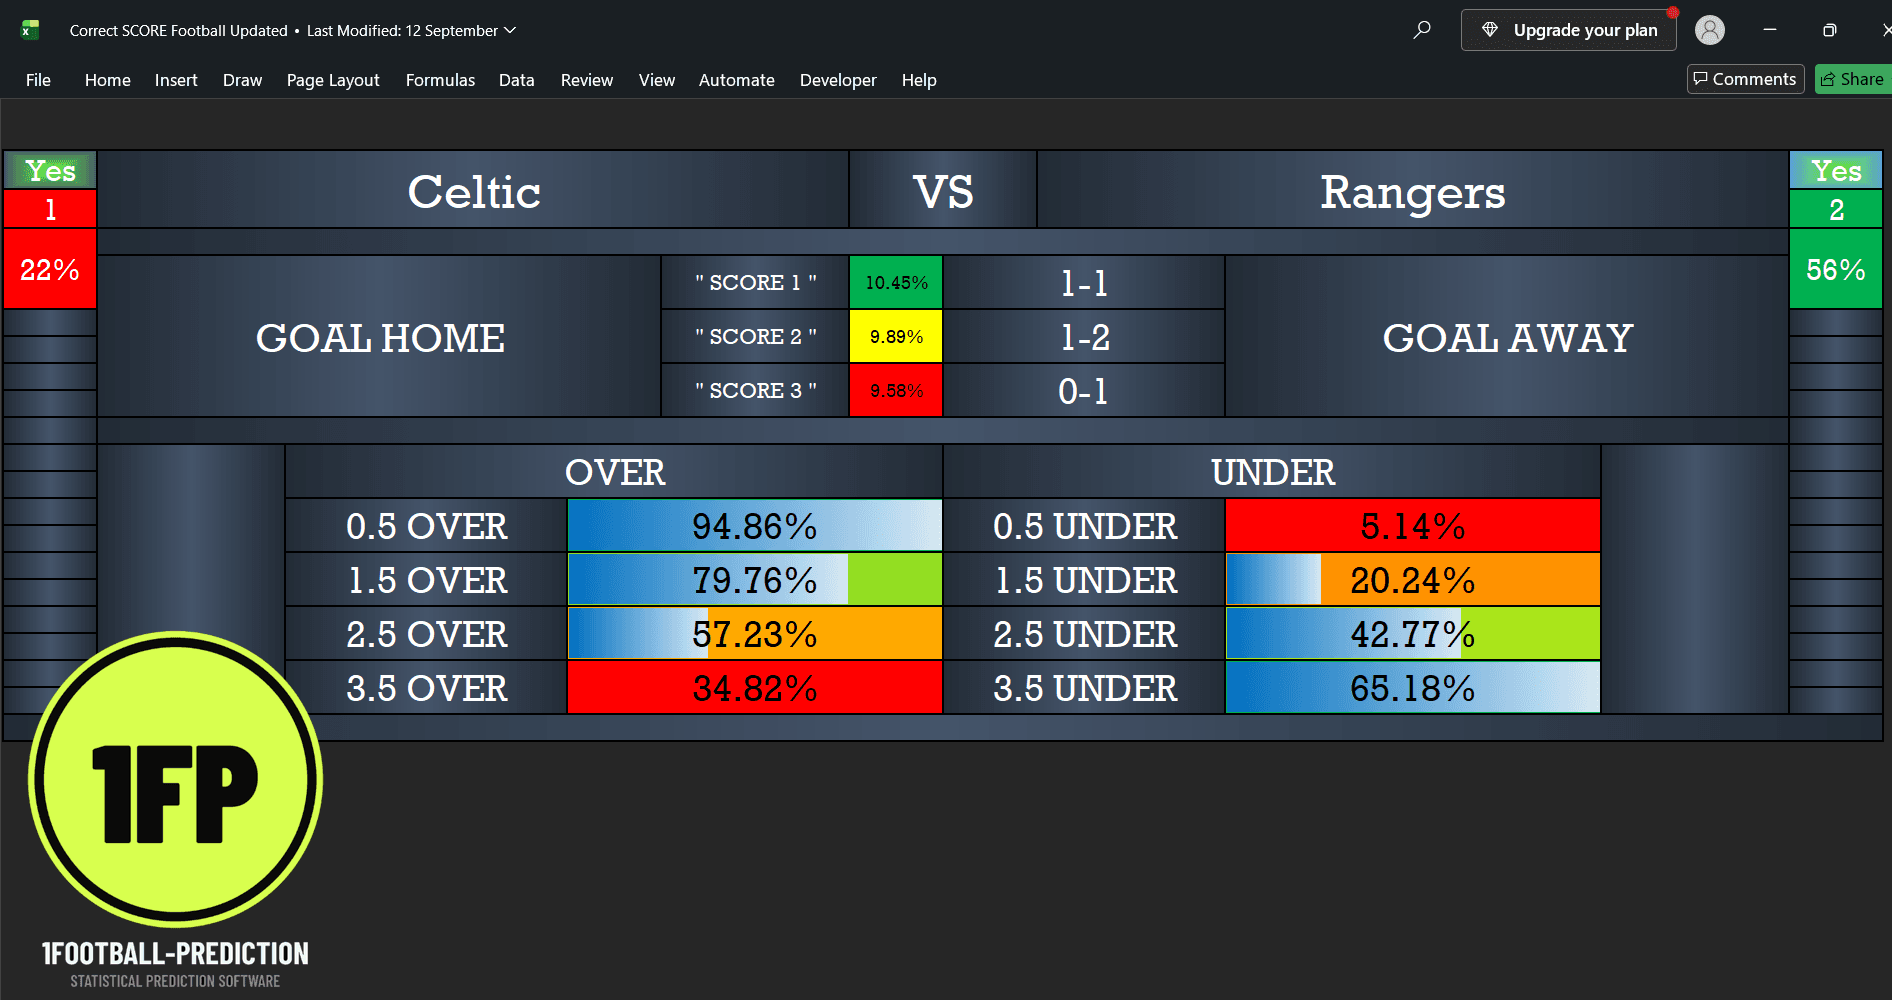
Original supplied software screenshot, unchanged. The displayed probabilities are estimates; the image does not establish when this forecast was generated.
Correct score explained · Celtic vs Rangers
To get a football correct score prediction, start with a set of estimated score probabilities, compare the leading outcomes, and check the match context before drawing a conclusion. An exact-score prediction is an estimate of both teams' goals—not a promise that one score will happen.
This guide uses the original Celtic–Rangers software screenshot above and the supplied result image below to show how to read the numbers. The key detail: 0–1 appears as the third score, at 9.58%, while 1–1 ranks first at 10.45%.
Quick answer: Read the probability beside each score, not just its position in the list. A top-ranked score can still have a low individual probability. Keep your original selection rule unchanged when comparing it with the result.
Celtic vs Rangers: the three displayed scores
The workbook is titled “Correct SCORE Football Updated” and shows Celtic as the home team and Rangers as the away team. Scores are read home team first: 0–1 means Celtic zero, Rangers one.
| Displayed position | Correct score | Software estimate | Comparison with the supplied result |
|---|---|---|---|
| Score 1 | 1–1 | 10.45% | Does not match |
| Score 2 | 1–2 | 9.89% | Does not match |
| Score 3 | 0–1 | 9.58% | Matches the displayed 0–1 result |
Only 0.87 percentage points separate the first and third scores. That is a narrow difference between estimates, not a reason to treat the top entry as certain.
The three entries add up to 29.92%. If they belong to one complete score distribution, the other outcomes account for 70.08%. This is why a shortlist of three scores should not be described as covering nearly every possible result.
The original result screenshot
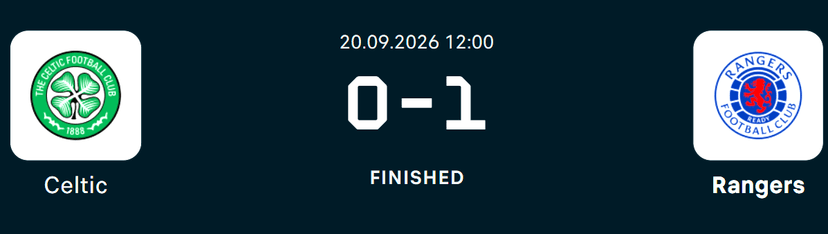
Original image supplied by 1Football Prediction, reproduced without alterations. It displays Celtic 0–1 Rangers and the status “Finished”.
Celtic's official match announcement confirms the fixture on 20 September 2026 with a noon kick-off at Celtic Park. The result comparison here is based on the supplied screenshot; the official page available during preparation did not yet provide a final score.
The two images show a match between the third listed scenario and the displayed result. They do not establish when the software output was generated. The workbook's “Last Modified: 12 September” label is not a timestamp for this particular forecast. This is therefore a retrospective screenshot walkthrough, not independent verification of a pre-match prediction.
How to get and evaluate a football correct score prediction
- Check the fixture. Confirm the teams, home/away order and match date. A 1–2 prediction is different from 2–1.
- Read the score probabilities. Compare more than one scenario. Here, the highest displayed estimate is only 10.45%, leaving substantial uncertainty.
- Check relevant match information. Consult reliable team news and lineups. Do not assume a particular software model incorporates those inputs unless its documentation says so.
- Save the output before the match. Keep the complete screen, generation time and software version. This makes later evaluation more useful than a screenshot saved only after a result.
- Define the rule before the outcome. Evaluating the first score only is different from evaluating a three-score shortlist. In this example, the first-score selection misses while the shortlist contains the supplied result.
- Record every eligible match. Include misses, unresolved games and your unchanged selection rule. One selected example cannot measure long-term accuracy or profitability.
What the goals probabilities add
The same screenshot also shows these over/under estimates. They refer to the combined number of goals, not the exact allocation between Celtic and Rangers.
| Total-goals line | Over | Under |
|---|---|---|
| 0.5 | 94.86% | 5.14% |
| 1.5 | 79.76% | 20.24% |
| 2.5 | 57.23% | 42.77% |
| 3.5 | 34.82% | 65.18% |
A 0–1 result contains one goal: it is over 0.5 but under 1.5, 2.5 and 3.5. The larger over-1.5 and over-2.5 estimates therefore did not align with the result shown. Keeping those misses visible gives a more balanced reading than highlighting only the matching correct score.
If these goal lines come from the same distribution, the implied probability of exactly one total goal is 94.86% − 79.76% = 15.10%. That includes both 1–0 and 0–1; it is not the probability of an away win alone.
Explore the correct score software
Compare the software features
See the Windows and Microsoft Excel requirements, scoreline forecasts, goals markets and access details before choosing a tool.
See another screenshot walkthrough
Compare this example with the Brentford–Chelsea article and its explanation of score rankings and goal probabilities.
The free football predictions, methodology and public track record relate to the separate website model. They should not be used as evidence of the paid workbook's performance.
Frequently asked questions
Can software guarantee a football correct score?
No. A model estimates possible outcomes. Neither a high ranking nor one matching example guarantees the next result.
Did the software's first score match this result?
No. The first score was 1–1. The supplied 0–1 result matches the third listed score, shown at 9.58%. Those are different evaluation rules and should be reported separately.
Is 9.58% a measured accuracy rate?
No. It is the model estimate displayed for 0–1 in this screenshot. A measured accuracy rate requires a defined set of forecasts and their outcomes.
Why keep the original screenshots?
They let readers check the displayed figures for themselves. Both originals are preserved here; their limitations, including the missing forecast-generation timestamp, remain part of the explanation.
Prepared by 1Football Prediction with AI assistance, using the two supplied screenshots and the linked official fixture announcement. This is an explanation of one example, not an independent performance test.
18+. Predictions are estimates, not guarantees. Support for gambling-related harm.