
Premier League Correct Score: Software Guide
Quick Answer
Learn how to review Premier League correct-score predictions in Excel, compare score probabilities and assess a Leeds–Tottenham example with original images.
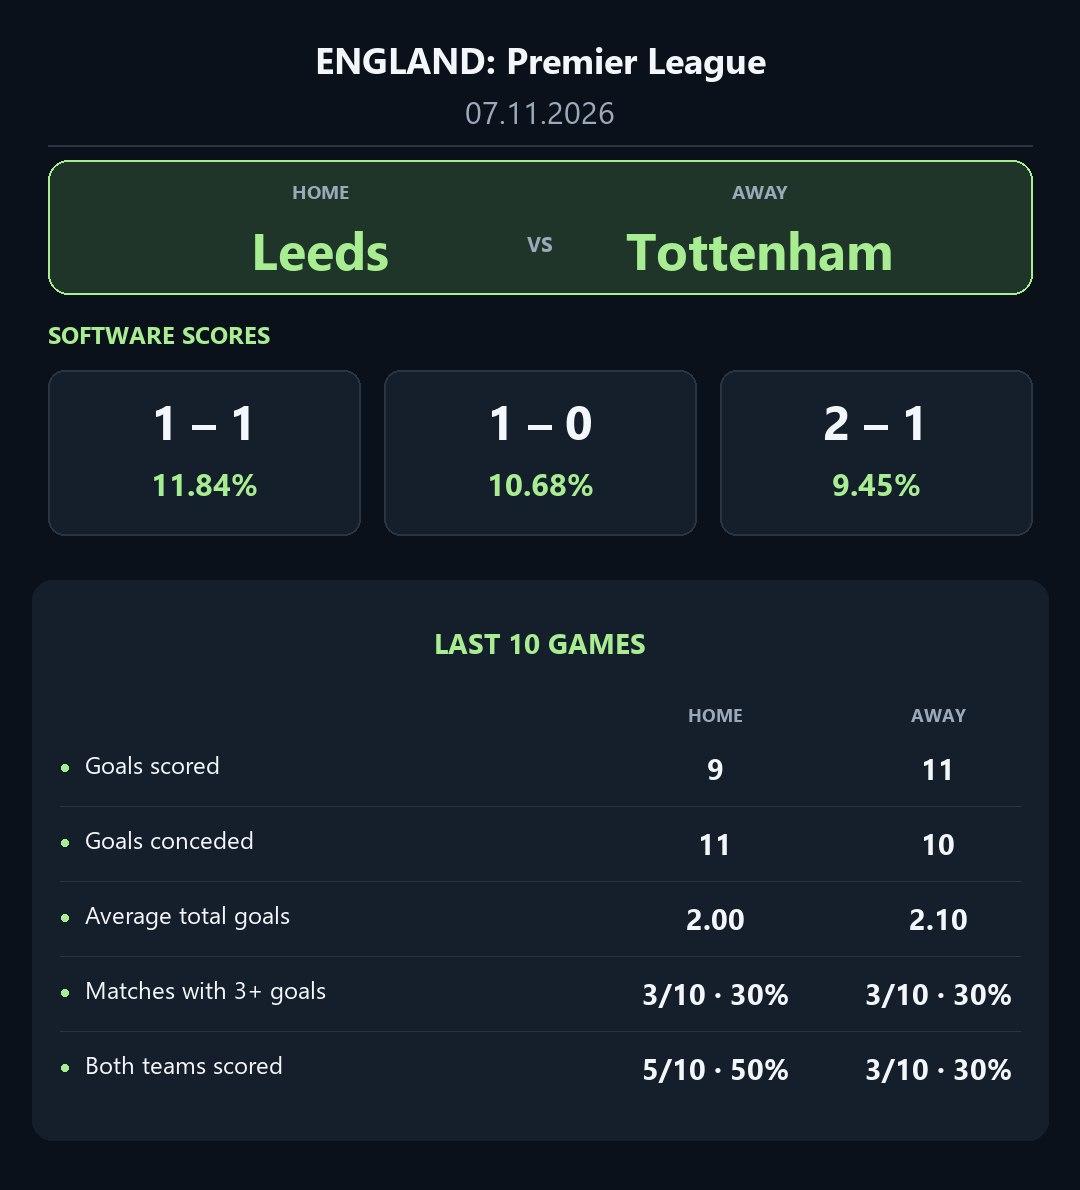
Owner-supplied report dated 7 November 2026. Percentages are model estimates, not a verified success rate.
Getting a Premier League correct-score prediction starts with comparing possible results—not assuming that one score is certain. Correct Score Football Software helps you review three score scenarios alongside match-result, goals and both-teams-to-score estimates.
This guide explains how to access and interpret software reports; it is not a live list of today’s Premier League picks. The original Leeds–Tottenham report shown above is a dated example used to explain the process. It lists 1–1, 1–0 and 2–1, while the accompanying result graphic displays Leeds 1–0 Tottenham. The matching score was the report’s second-listed selection, an important detail when assessing the example.
How to get correct-score predictions from the software
Correct Score Football Software runs on a Windows PC with Microsoft Excel. The current product listing offers a digital download, automatic daily updates and 12 months of access through a single payment.
To review Premier League predictions:
- Check the product requirements and access terms before purchasing.
- Download the workbook and follow its setup instructions.
- Review an available Premier League fixture, checking the date and home/away order.
- Compare the three displayed scorelines and their estimated probabilities.
- Read the goals and match-result information alongside the exact scores.
- Save the report before kick-off and record the outcome afterwards, including unsuccessful selections.
Check the product page for current availability, pricing and delivery details.
Checking today’s Premier League fixtures
Use a fresh report for the fixture you want to assess. The Leeds–Tottenham images in this article remain a dated teaching example; they should not be reused as a forecast for a later meeting.
Before interpreting a new report, check:
- Fixture identity: the date, competition and home/away order must match the scheduled game.
- Report freshness: note when the output was generated and whether the match has been postponed or rescheduled.
- Team information: review confirmed line-ups and absences separately unless the software documentation confirms that its report includes them.
- Market definition: distinguish the exact score from the match winner, goal total and BTTS. Confirm the settlement period if comparing a betting market.
- Missing information: if the fixture or report is unavailable, do not substitute an older prediction.
The software’s automatic daily updates describe its update feature, not a promise that every fixture is available or that a correct score will be found each day.
Leeds vs Tottenham: reading the original report
The original report shown above is dated 7 November 2026. Its percentages are model estimates for individual scorelines.
| Displayed score | Estimated probability | Position in the report |
|---|---|---|
| Leeds 1–1 Tottenham | 11.84% | First |
| Leeds 1–0 Tottenham | 10.68% | Second |
| Leeds 2–1 Tottenham | 9.45% | Third |
The report gives 1–1 the highest probability of these three scores. It also includes a narrow Leeds victory, with 1–0 estimated at 10.68%.
That does not mean the software gives Leeds a 10.68% chance of winning overall. A home-win probability includes every possible home-win score; 1–0 is only one of them.
The three displayed estimates total 31.97%, so this shortlist does not cover every possible result. A useful report presents alternatives, but those alternatives remain uncertain.
What the last-ten-games figures add
The report also supplies the following figures under “Last 10 Games”:
| Measure | Leeds | Tottenham |
|---|---|---|
| Goals scored | 9 | 11 |
| Goals conceded | 11 | 10 |
| Average total goals | 2.00 | 2.10 |
| Matches with three or more goals | 3/10 — 30% | 3/10 — 30% |
| Both teams scored | 5/10 — 50% | 3/10 — 30% |
These displayed records help explain why lower-scoring possibilities deserve attention. Both samples show three or more goals in only three of ten matches.
However, these are historical figures presented by the report, not probabilities for the next match. The image does not identify every fixture in the sample, so it cannot establish how comparable those games were.
The supplied 1–0 result example
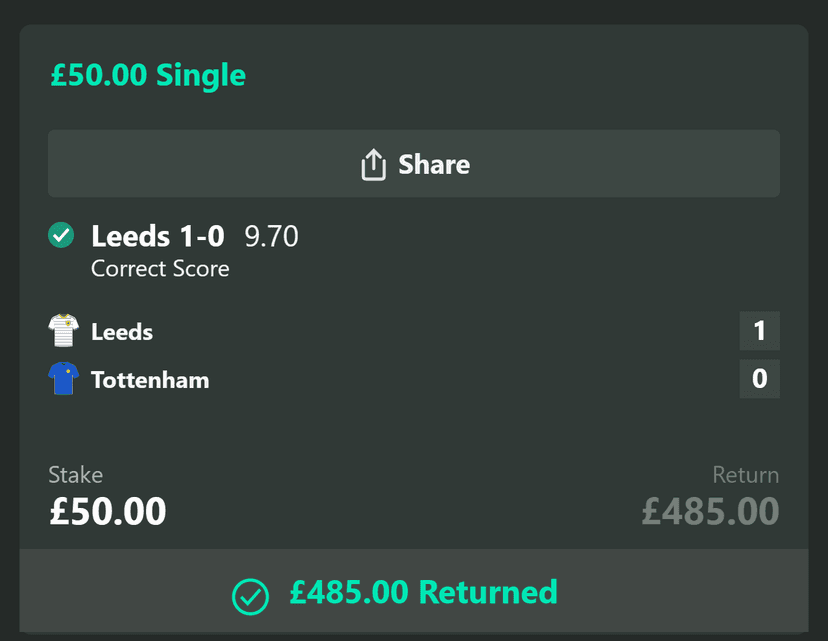
Original supplied result graphic. It displays a £50 stake and £485 total return for Leeds 1–0; it is not an independently verified betting record.
The result graphic matches the second-listed score, 1–0, in the prediction report.
The displayed return is mathematically consistent with the stated stake and odds: £50 × 9.70 = £485, including the original stake. It should not be described as £485 profit.
This example also shows why the selection rule matters. Choosing only the highest-ranked score would have meant selecting 1–1, which does not match the result shown. Choosing 1–0 would match it, but the images do not explain why that selection was made.
Neither image alone establishes when the forecast became available, verifies the official match result, or demonstrates the software’s overall accuracy. A meaningful performance record needs dated forecasts and all outcomes, including losses.
Is Correct Score Football Software right for you?
The software is intended for readers who want to compare match scenarios in Excel. Its product listing includes three correct-score predictions, over/under 2.5 goals, 1X2 match outcomes and BTTS Yes/No analysis.
That combination is useful when checking whether different markets support the same interpretation. A 1–0 score, for example, means a home win, under 2.5 goals and BTTS No. Those are related outcomes, but they are not interchangeable predictions.
The supplied report is used here as a worked example of reading score probabilities. Its image alone does not establish which product version or delivery service generated it.
Before buying, review the Correct Score Football Software details and tutorial, particularly the Windows and Excel requirements. Contact the store if you need confirmation about your setup or fixture coverage.
Related correct-score reading
For another worked example, read how to get football correct scores from AI software. That guide explains the Liverpool–Arsenal score shortlist and how to compare it with the over/under table.
How to judge future predictions fairly
Keep a record of the exact selection you make before kick-off. Note the report date, scoreline, displayed probability and final result. If you track several scores per match, record every selection separately.
This prevents a common mistake: treating any winning score somewhere in a shortlist as proof that the first recommendation was correct.
Use the Leeds–Tottenham example to understand the report’s format, then assess a complete run of predictions rather than isolated winning images. You can also review the store’s evidence library when comparing examples and their limitations.
To get started, explore Correct Score Football Software and check whether its analysis format fits your needs. Use the estimates to inform your own assessment; no software can guarantee a Premier League correct score.
18+. Predictions are uncertain, and betting can result in losses.