How To Get Correct Score Predictions With AI Software
A step-by-step guide to generating correct score predictions with AI football software: how the model works, how to read a probability table, and what to look for in reliable software.

Correct score is widely considered the hardest bet in football, and the reason comes down to basic math. A single match has dozens of realistic final scorelines, from 0-0 through to something like 4-2, and you have to land on one. Compare that to a sport like basketball, where dozens of scoring events happen every game and final margins cluster into a fairly predictable range. Football's low-scoring nature spreads probability thin across many outcomes, which is exactly why no single scoreline in a match usually clears much more than 10 to 15%, even for a strong favourite.
That's also why AI-based prediction software suits this market so well. Instead of a single gut-feel pick, a proper statistical model builds a full probability grid across every realistic scoreline at once, so you can see where the genuine chances sit rather than guessing at one.
Inside the model: from team strength to a scoreline grid Here's the pipeline a correct score model actually runs, step by step.
Data collection. Recent results and fixtures come from a licensed football data feed, refreshed for every league covered.
Attack and defence ratings. Every team gets two numbers: how many goals they tend to score against an average opponent, and how many they tend to concede. These are calculated home and away separately, since home advantage is real and measurable in football.
Expected goals. For any single match, the model combines one side's attack rating with the other side's defence rating, plus a home-advantage adjustment, into an expected goals figure for each team. As a simple example: say a model estimates 1.4 expected goals for the home side and 0.9 for the away side in some match. Those two numbers become the entire input to the next step.
The Poisson distribution. This is the standard statistical tool for turning a single expected-goals number into a full probability spread across 0, 1, 2, 3 or more goals. An expected value of 1.4 doesn't mean a team scores exactly 1.4 goals, obviously. It means the model can calculate the probability of them scoring exactly 0, exactly 1, exactly 2, and so on, with everything adding up to 100%.
Combining both sides. Multiply the home side's goal probabilities against the away side's goal probabilities for every combination, and you get a probability for every scoreline: 0-0, 1-0, 0-1, 1-1, 2-0, 2-1, and so on. That grid is where a correct score prediction actually comes from.
Many models refine this further with an adjustment for low-scoring draws, since a simple independent Poisson model tends to slightly under-rate scores like 0-0 and 1-1 compared to what happens in real football. This is often called the Dixon-Coles adjustment, after the 1997 academic paper that first proposed it, and most serious correct score tools apply some version of it.
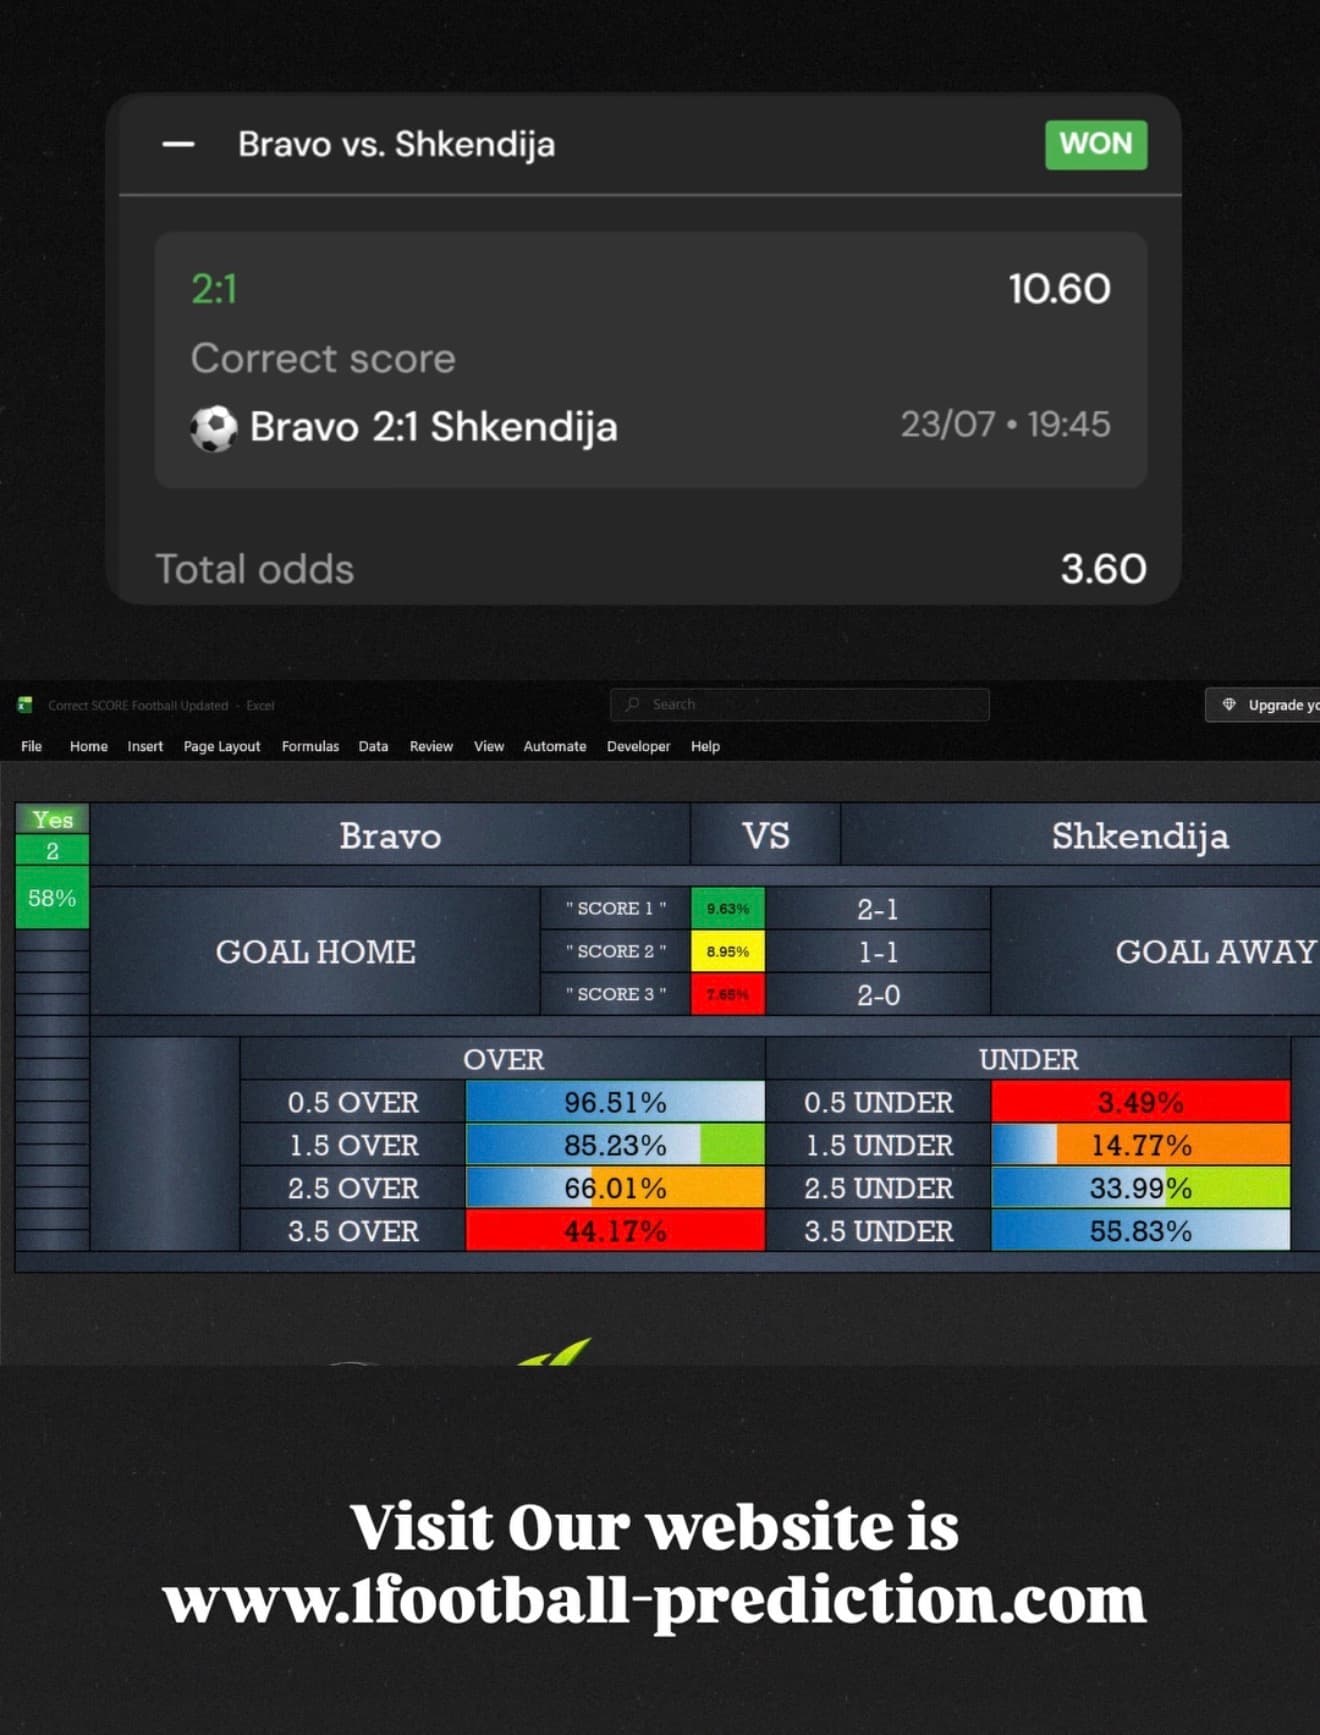
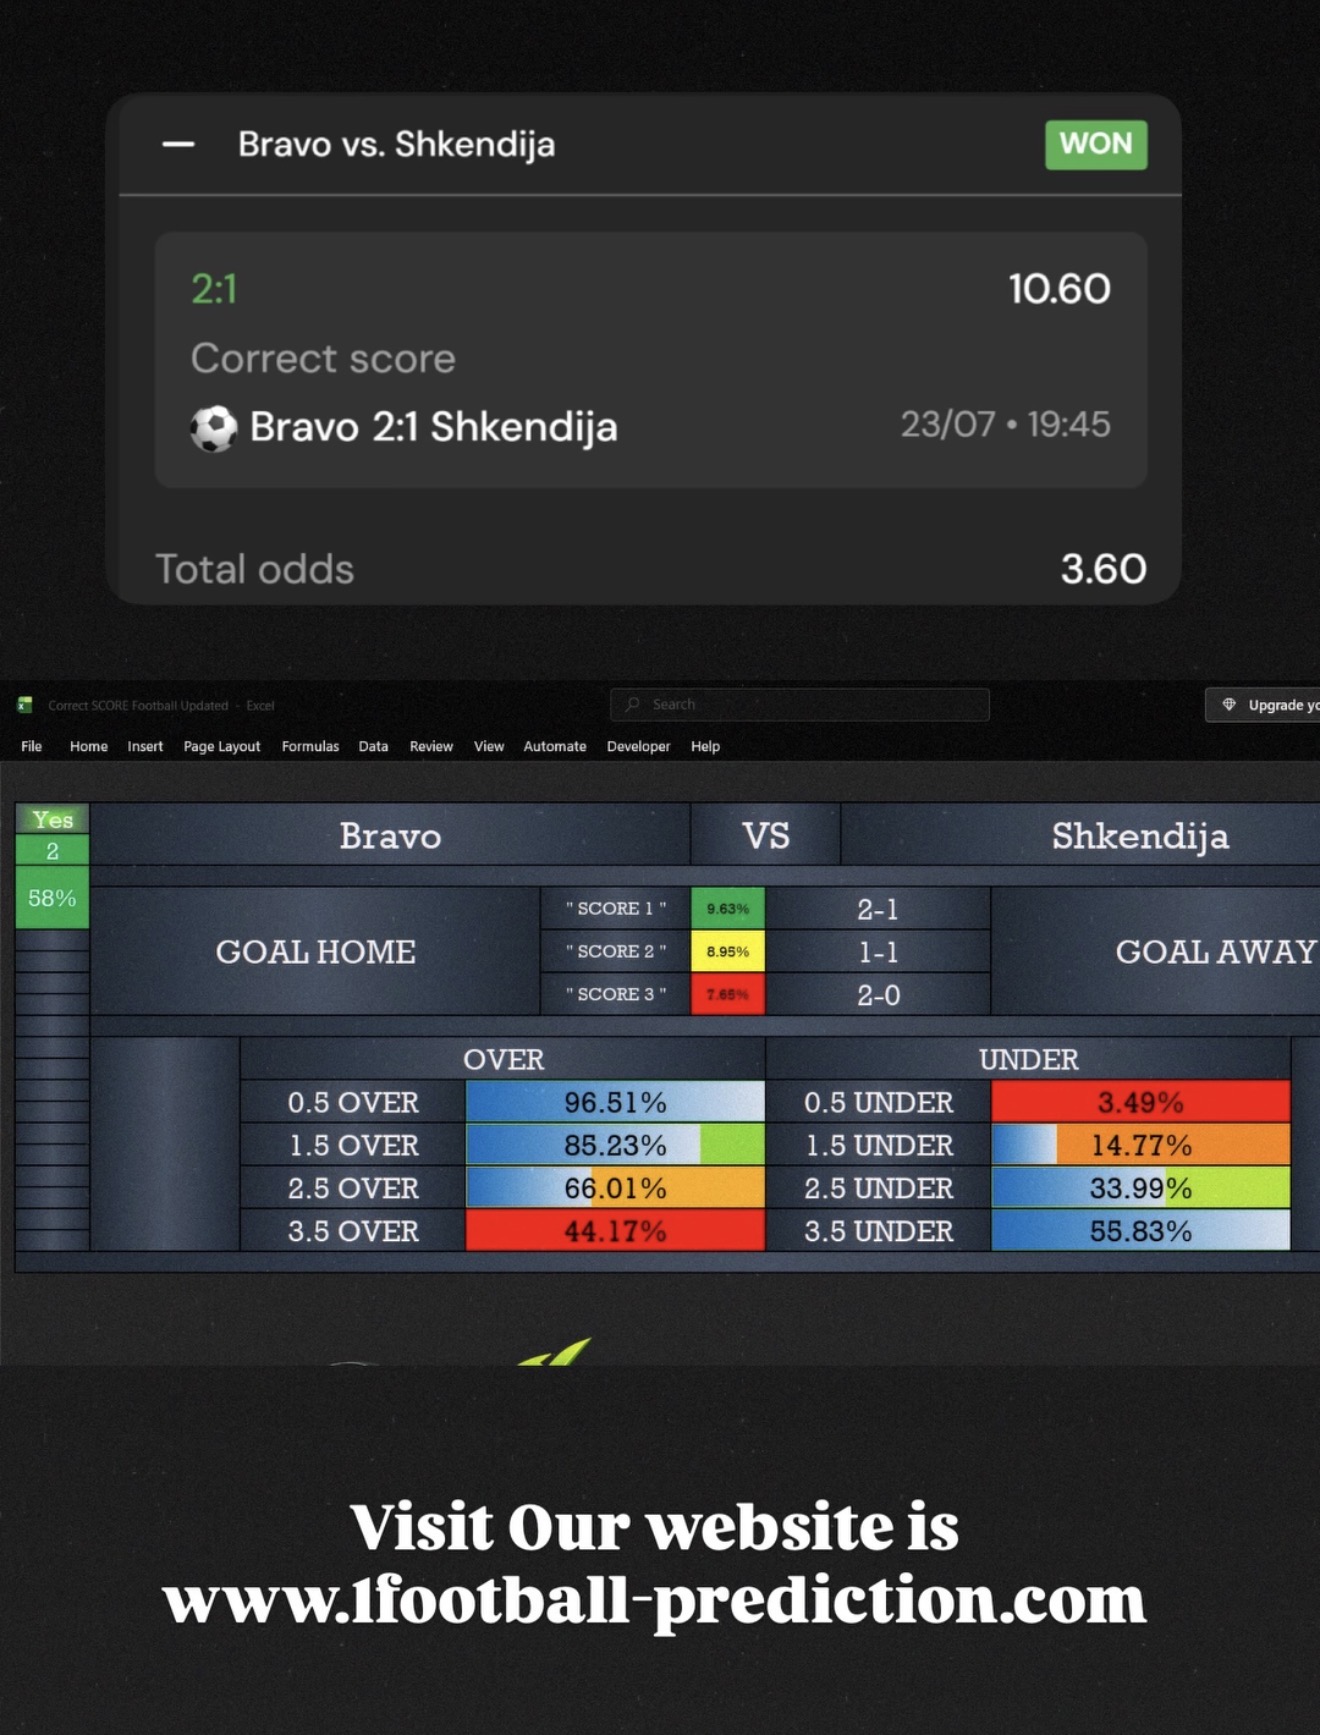
Reading a real probability grid Here's an actual Correct Score Football Software output, for Bravo vs Shkendija:
Scoreline Model probability 2-1 9.63% 1-1 8.95% 2-0 7.65% Goals market Over Under 0.5 96.51% 3.49% 1.5 85.23% 14.77% 2.5 66.01% 33.99% 3.5 44.17% 55.83% These two tables aren't separate calculations. The over/under lines are the same underlying scoreline grid, added up a different way, every scoreline with 3 or more total goals gets summed into "over 2.5," for example. That's why the goals markets read with much higher confidence (96.51% for over 0.5) than any individual scoreline (9.63% for the top pick): you're summing dozens of small probabilities into one large one, instead of looking at a single slice of the grid.
The top-rated scoreline here, 2-1, sat under 10%. That's not a weak model, it's what an honest correct score output looks like. The actual result that day was 2-1, one of several scenarios the model had live going into kick-off, alongside 1-1, 2-0 and others.
From probability to a decision: what "value" means A model probability on its own doesn't tell you whether a price is fair, it needs to be compared against the odds on offer. Decimal odds imply their own probability, roughly 1 divided by the odds, before the bookmaker's margin is stripped out. Analysts use the term "value" when a model's probability for an outcome sits meaningfully above what the odds imply. It describes a gap between two probability estimates, not a promise about any single result. This is one reason experienced users look at two or three of the higher-probability scorelines together rather than fixating on the single top pick, since that gap can show up anywhere in the grid.
What separates reliable software from a guess A named, licensed data source. A model is only as good as the results it learns from. Regular, fixture-by-fixture updates. Team form changes, and a stale model doesn't catch it. A full grid, not one pick. If a tool only shows a single "banker" score with no other context, you're not seeing the underlying probabilities. Honest language about confidence. A pick shown at 60% should land close to six times in ten over a large enough sample, not every time, and the software should say so plainly. No guaranteed or fixed match claims. There's no such thing as a certain scoreline. Anyone claiming otherwise isn't running a real model. Common mistakes to avoid Treating the top pick as a certainty. Even the best-rated scoreline in this market is usually still an underdog against everything else combined. Judging a model from one result. A single hit or miss is close to meaningless statistically. Model quality only shows up over a run of fixtures. Ignoring the derived markets. Over/under and BTTS come from the same grid and are usually the more stable read. Betting more than you can afford to lose, especially in a market this volatile. FAQs How accurate are AI correct score predictions? No software can guarantee an exact scoreline, football's low-scoring nature makes that mathematically unrealistic. A good model gives you a realistic, regularly updated probability for every outcome, so you can see which scores are genuinely live rather than guessing.
Why do the top scorelines in the table always look low, like under 10%? Because that's an accurate reflection of the market, not a flaw in the software. A match with dozens of plausible scorelines will rarely have any single one much above 10 to 15%, even for a heavy favourite.
What's a sensible way to use a correct score grid? Look at the top two or three scorelines as a shortlist rather than a single certainty, and cross-check them against the derived goals markets on the same grid, which tend to be the more stable read.
Try it yourself Correct Score Football Software runs this exact process across the leagues we cover, refreshed every morning from a licensed data feed. View the software →
Want to try the approach at a lower price point first? AI Football for Correct Score covers the same market. View the software →
18+. Please gamble responsibly. Predictions are statistical probabilities, not guarantees. begambleaware.org