Besiktas vs Midtjylland: Reviewing the Forecast Arithmetic
Quick Answer
Why the Besiktas–Midtjylland preview's result and BTTS percentages need source verification before they can support a match forecast.
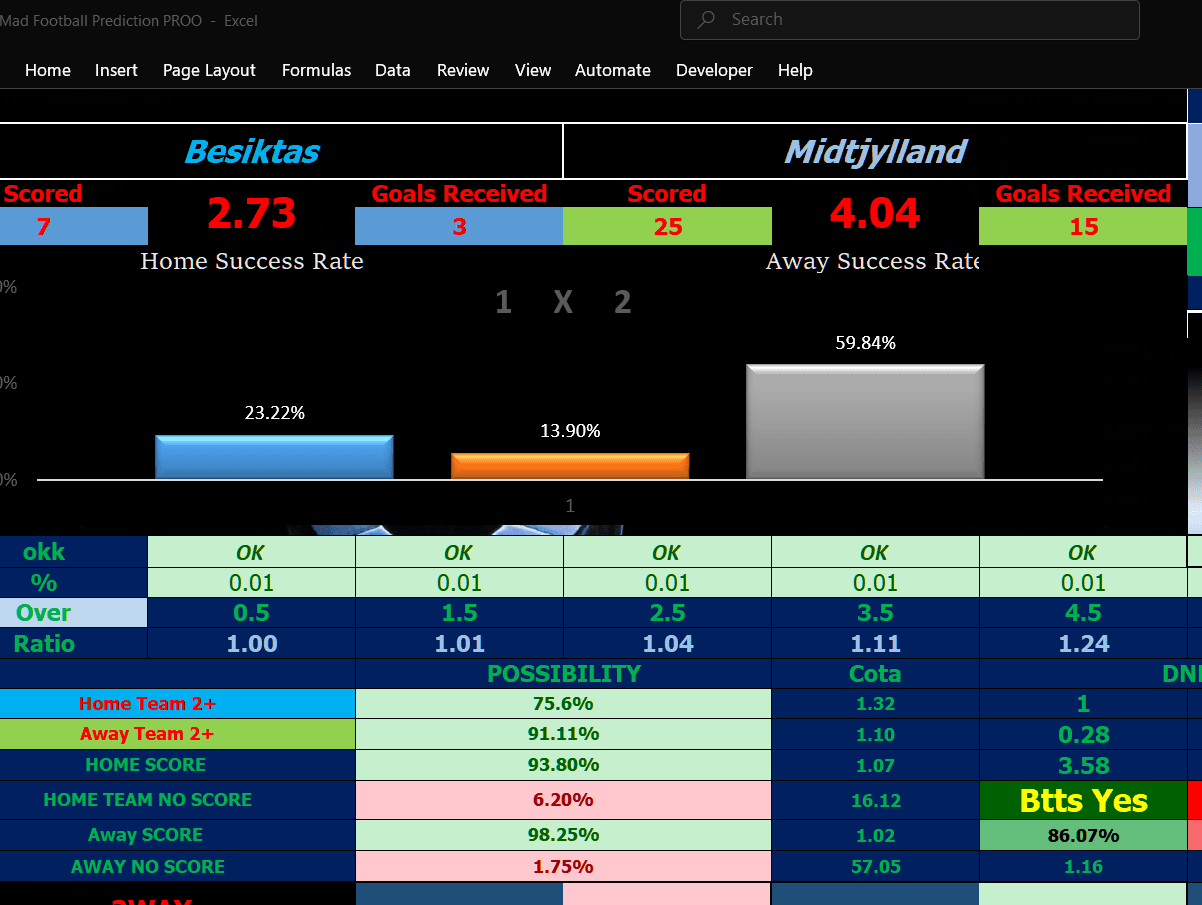
The earlier Besiktas–Midtjylland article described a strong away-win and high-goals forecast. Its published percentages contain inconsistencies that should be checked before using that interpretation.
The archived match-result table
| Outcome | Previously published value |
|---|---|
| Besiktas win | 23.22% |
| Draw | 13.90% |
| Midtjylland win | 59.84% |
| Total | 96.96% |
The missing 3.04 percentage points cannot be explained by ordinary rounding to two decimal places. The article does not identify a separate fourth normal-time result. We have not normalised the figures or invented the missing share.
The team-scoring check
Besiktas to score was quoted at 93.80% and Midtjylland at 98.25%. Their joint probability must therefore be between 92.05% and 93.80%, for the same events and period.
The article's BTTS figure, 86.07%, falls below that interval. A coherent forecast cannot contain all three figures with those meanings.
Why the high-goals narrative is insufficient
Approximate over-goals percentages and a confident description of attacking form do not repair the inconsistency. Nor do sample totals without the dates, number of matches and source provide a reproducible explanation.
The original fixture-specific output, generation time and product version have not been established in this review. Match logistics and squad context should be checked against an official competition source before being republished as current information.
How to improve the evidence
Keep the original output, identify exactly what each field measures, and compare values from one run. If the workbook uses a finite score grid, its treatment of probability outside that grid needs to be documented. If the numbers came from different periods, label them accordingly.
For a separate explanation of how to read a forecast, see the software guide. Product requirements and demonstrations are available in the store. This archive does not demonstrate paid-software accuracy or returns.
Correction, 19 September 2026: Identified the incomplete 1X2 total and incompatible scoring/BTTS values; removed unsupported fixture and model-performance narrative.
Revised with AI assistance using the available article evidence. Predictions are estimates, not guarantees. 18+. Support for gambling-related harm.