
Viborg vs Aarhus: Reading the Euro Software Screenshot
A screenshot-based explanation of Viborg–Aarhus goals estimates, ten-match frequencies, double chance and the limits of the saved output.
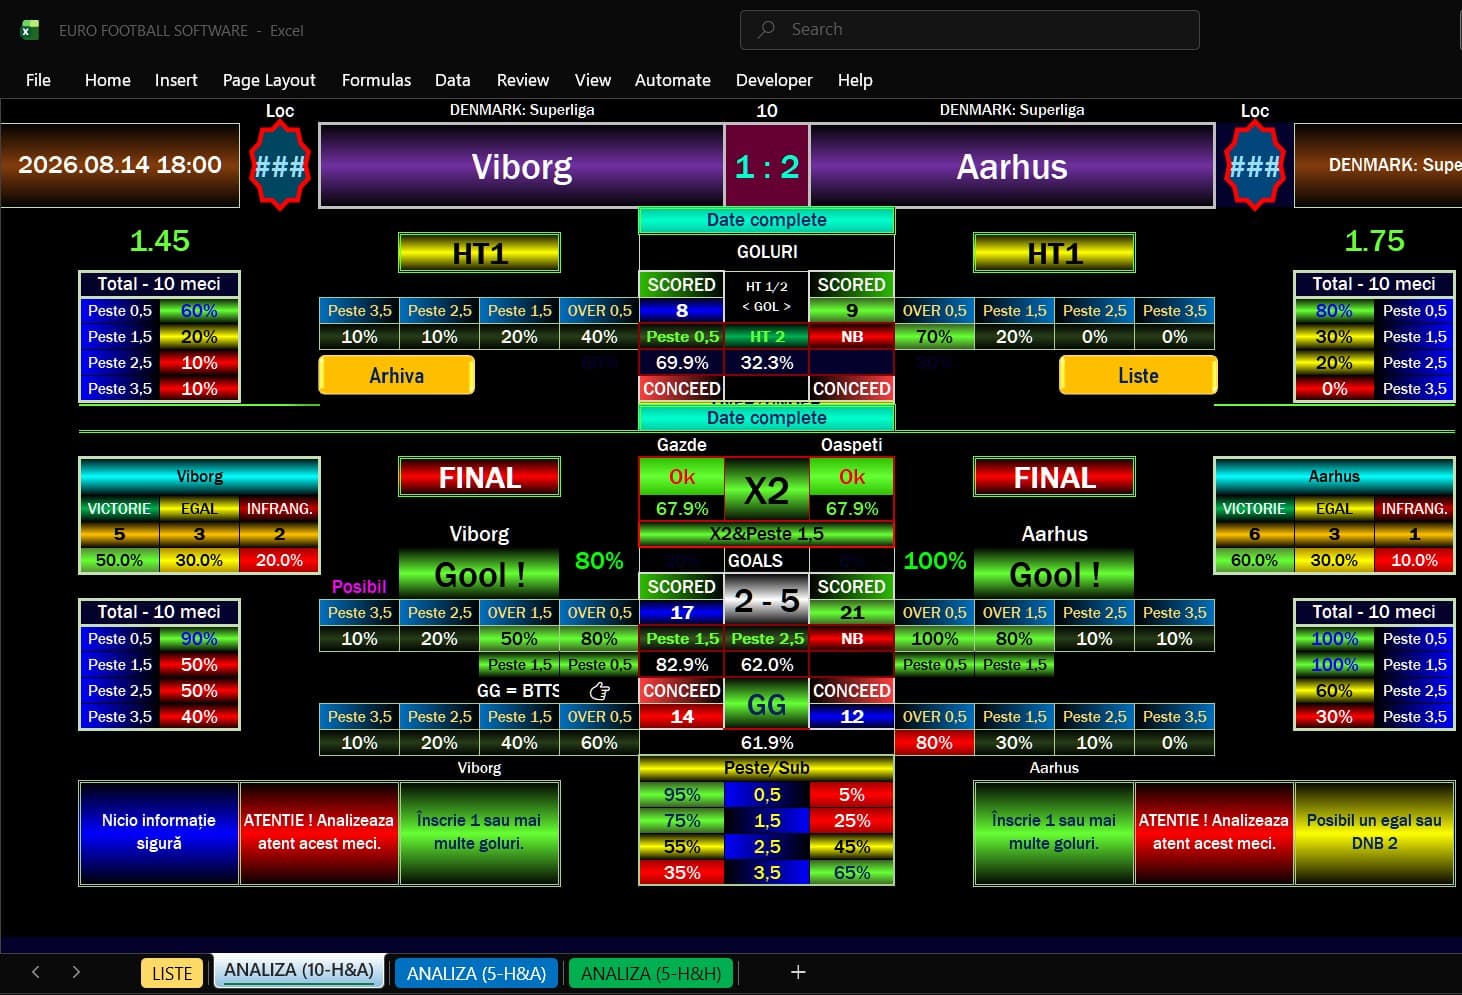
Saved software output. The fixture date is visible; the forecast generation time and product version are not established.
The saved Euro Football Software screenshot identifies Viborg and Aarhus and displays a fixture date of 14 August 2026. It provides a useful example of why forecast estimates and historical frequencies must be read separately.
Values visible in the screenshot
| Central output | Displayed value |
|---|---|
| X2 | 67.9% |
| Over 1.5 | 82.9% |
| Over 2.5 | 62.0% |
| GG / BTTS | 61.9% |
| First-half over 0.5 | 69.9% |
| HT 2 | 32.3% |
| Header score | 1–2 |
The image also shows a ten-match record of 5 wins, 3 draws and 2 defeats for Viborg, and 6 wins, 3 draws and 1 defeat for Aarhus. These are visible sample counts, not an independently checked match database.
Why similar labels can show different numbers
The lower over/under table shows 75% for over 1.5 and 55% for over 2.5, while the central estimates are 82.9% and 62.0%. They should not be quoted interchangeably. The screen contains sample summaries alongside calculated outputs; exact formulas require the workbook documentation.
A displayed 100% in a sample panel does not mean an event is certain in the next match.
A check on the combined selection
The screen shows X2 with over 1.5. From the two marginal estimates alone, the joint probability is bounded by 50.8% and 67.9%. The screenshot does not supply a clearly labelled joint percentage, so this article does not invent one.
The 1.45 and 1.75 values visible at the top total 3.20. Their product-specific meaning should be checked before describing them as shot-based expected goals. Even if treated as Poisson goal rates, that would be an assumed calculation rather than verification of the workbook's internals.
Evidence limits
The image shows a fixture date, not a forecast-generation timestamp or product version. It does not prove when the run was made or whether the 1–2 label predicted the actual result. We have removed unsupported travel, injury and championship narratives.
Open the original screenshot or see the related Euro software listing. The free website record is a separate service.
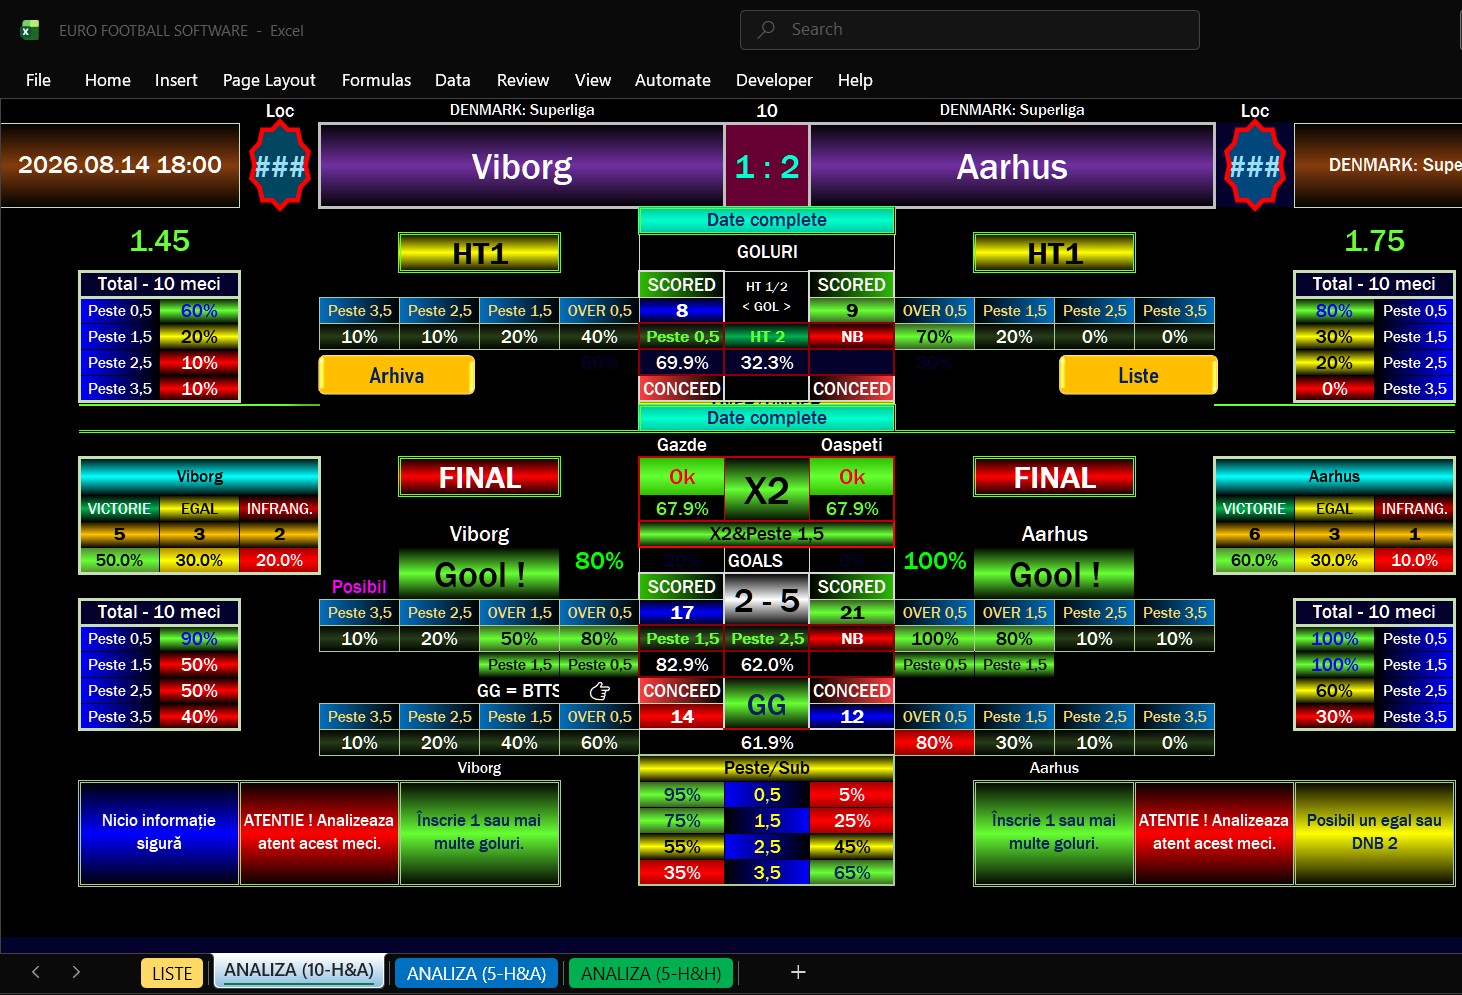
Correction, 19 September 2026: Checked the screenshot values and distinguished frequencies from model estimates; removed unverified team news and pre-match timing implications.
Revised with AI assistance using the available article evidence. Predictions are estimates, not guarantees. 18+. Support for gambling-related harm.