
FC Porto vs Paredes: Correct Score Software Analysis
Quick Answer
Explore FC Porto vs Paredes correct-score software estimates, the supplied 1–1 result graphic and what the goals probabilities mean.
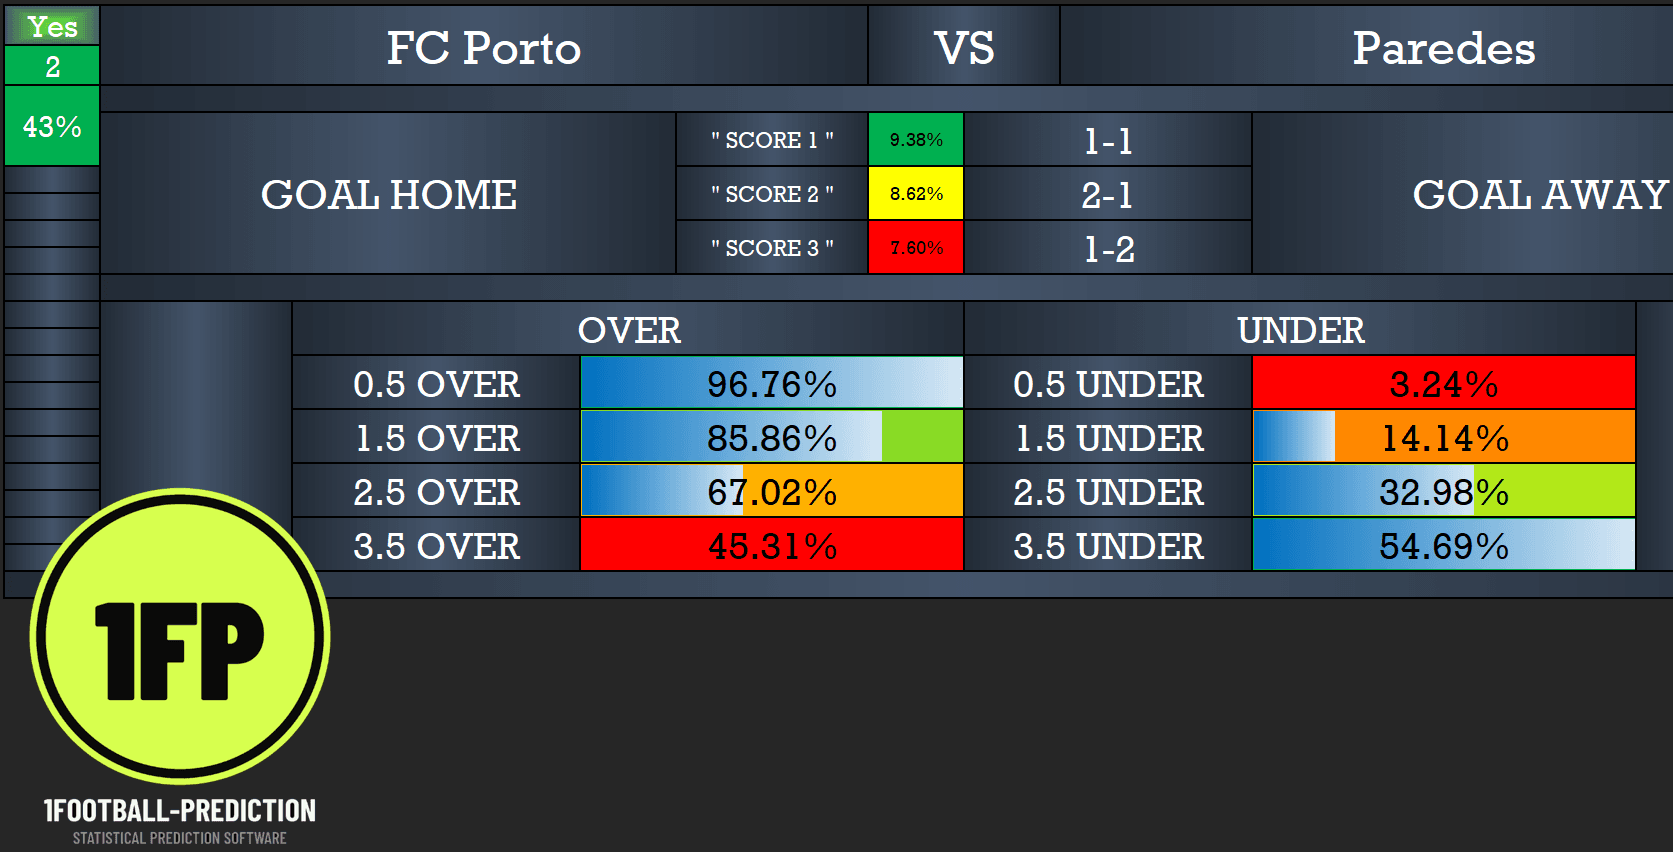
Original supplied software output. Percentages are model estimates; the screenshot does not establish when the forecast was generated.
The supplied FC Porto vs Paredes screenshots show a clear comparison: 1–1 was the software’s highest-ranked score suggestion, and the accompanying result graphic also displays a 1–1 draw.
Here is what the figures mean, how the goals estimates compare, and what this example tells us about using football prediction software.
The software’s three score suggestions
The original software screenshot above shows the score shortlist and over/under goals estimates.
| Suggested score | Software estimate |
|---|---|
| FC Porto 1–1 Paredes | 9.38% |
| FC Porto 2–1 Paredes | 8.62% |
| FC Porto 1–2 Paredes | 7.60% |
The draw ranked first among the three displayed outcomes, ahead of a narrow win for either side. All three suggestions included both teams scoring, although the screenshot does not provide a separate numerical BTTS probability.
The important detail is the size of the estimates. 9.38% is the leading displayed score probability, not a 93.8% confidence rating or a guaranteed result. Correct-score probabilities are spread across many possible outcomes, and the three listed scores do not cover every possibility.
The supplied result graphic
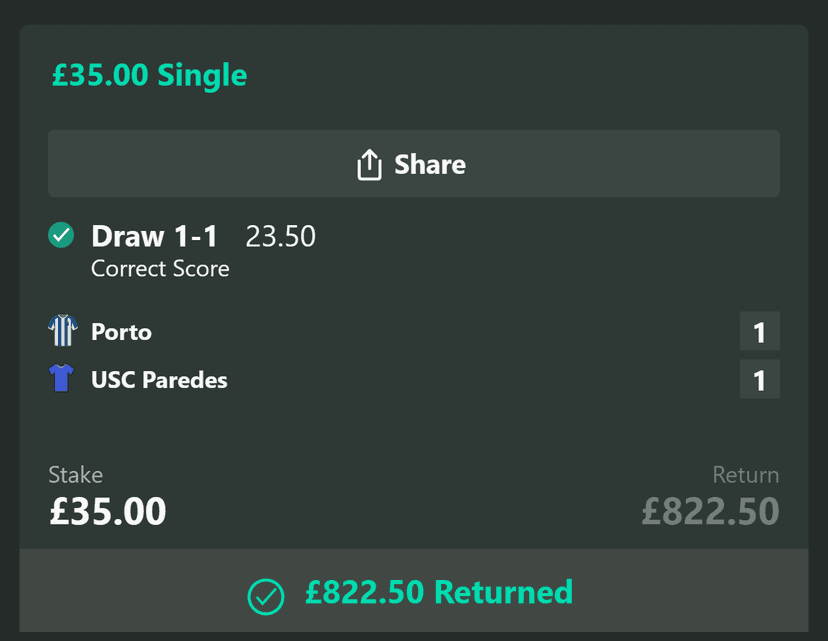
Original supplied graphic displaying a 1–1 draw and a £822.50 return, including the £35 stake.
The graphic shows Porto and USC Paredes level at 1–1, matching the first score listed in the software screenshot. It also displays a £35 selection at decimal odds of 23.50, with £822.50 marked returned.
These images provide an example for comparison, but they do not independently verify the match result, the betting transaction or whether the software calculation was recorded before kickoff. One matching score cannot establish an overall success rate.
How the goals estimates compare
The software also displayed the following totals:
| Goals market | Software estimate |
|---|---|
| Over 1.5 goals | 85.86% |
| Over 2.5 goals | 67.02% |
| Under 3.5 goals | 54.69% |
The displayed 1–1 outcome contains two goals. That agrees with over 1.5 and under 3.5, but not with over 2.5.
This is a useful reminder to assess every part of a forecast. A matching correct score does not mean all the accompanying market predictions were successful.
There is also no necessary contradiction between 1–1 being the leading individual score and over 2.5 having a higher overall estimate. The over 2.5 market combines many different scorelines, while 1–1 represents just one exact outcome.
Using correct-score software effectively
Start by confirming the fixture, date and home/away order. Then compare the score shortlist with the goals estimates rather than relying on a single highlighted number.
Save the output before kickoff and track every result, including unsuccessful predictions. A complete record is more useful than a collection of selected winning examples.
Our Correct Score Football Software provides an Excel-based interface for comparing score scenarios and related football markets. Review the product requirements and examples before deciding whether it suits your analysis.
For a practical walkthrough, read our daily correct-score software guide.
18+. Predictions are estimates, not guarantees. Only bet money you can afford to lose.