Live
AI football software for correct scoreOver 2.5 goals tipsBTTS tipsCorners tipsLive goals tipsFree football predictions updated dailyAI football software for correct scoreOver 2.5 goals tipsBTTS tipsCorners tipsLive goals tipsFree football predictions updated daily
4 August 2026

KuPS vs Universitatea Craiova Stats & Model Probabilities | Europa League

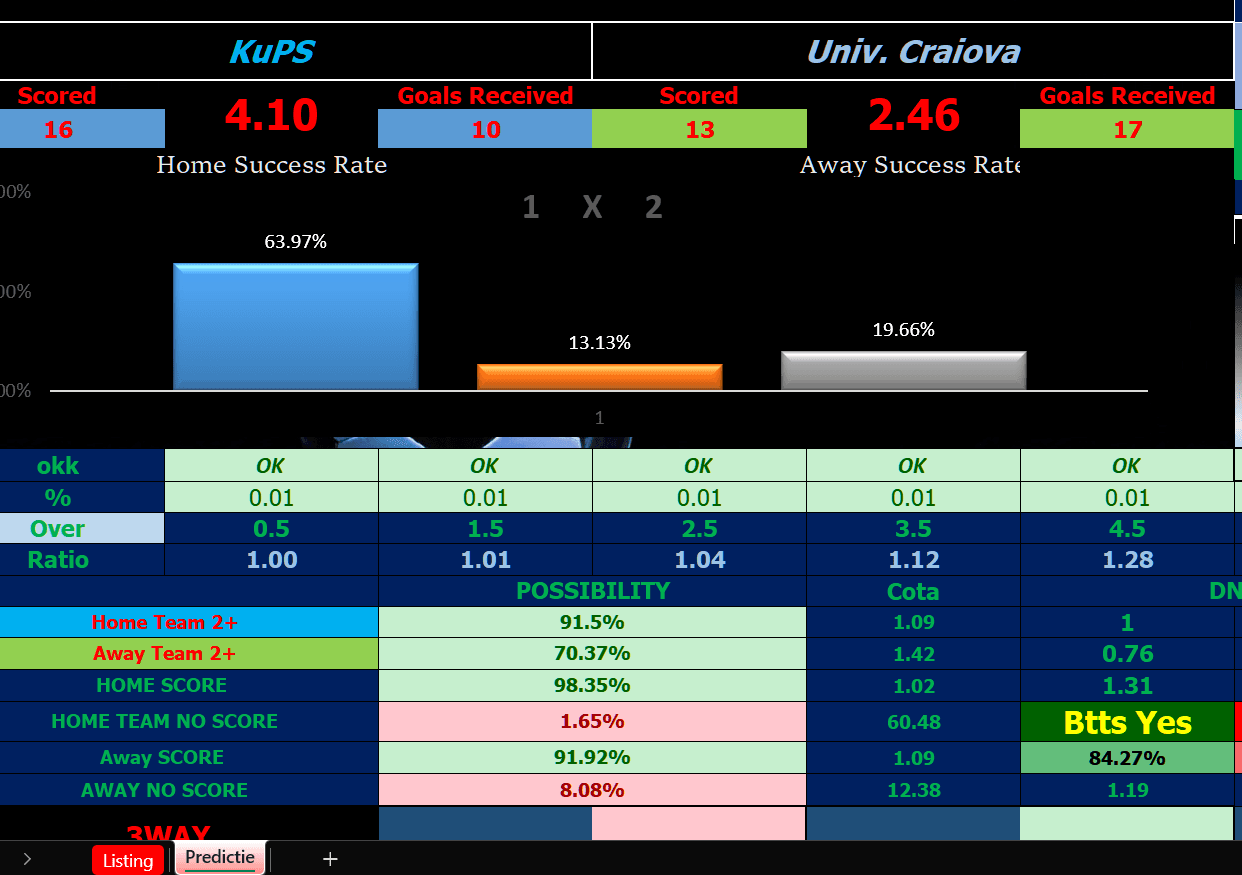
Our football prediction software has run KuPS vs Universitatea Craiova, the Europa League third qualifying round first leg in Kuopio. The model returns 63.97% for a home win and 84.27% for both teams to score. Here is the full breakdown.

KuPS vs Universitatea Craiova Stats & Model Probabilities | Europa League

KuPS host Universitatea Craiova at the Väre Areena in Kuopio on Thursday 6 August 2026 in the first leg of the UEFA Europa League third qualifying round. The return leg is scheduled for Craiova on 13 August. Kick-off times have been listed differently across outlets, so check the official UEFA fixture listing before you plan your evening.

Both clubs arrive here the same way. Universitatea Craiova, the reigning Romanian champions, went out of Champions League qualifying to Levski Sofia after a 2-2 draw at home following a first-leg defeat. KuPS also dropped out of the Champions League route earlier in the summer. So this is a tie between two sides who have already had their European ambitions trimmed once, and neither will want it to happen twice.

We ran the fixture through our football prediction software. Below is exactly what the model produced. These are model probabilities, not forecasts of what will happen.

The headline numbers

The model gives KuPS a clear edge on home advantage.

Outcome Model probability KuPS win (1) 63.97% Draw (X) 13.13% Universitatea Craiova win (2) 19.66%

The 13.13% draw figure is the number that jumps out. A draw is usually the second most likely single result in a European qualifier, and the model has pushed it well below the away win here. That is a direct consequence of how the goal expectancy is distributed, which we will come to in a moment.

The underlying strength ratings behind those numbers are 4.10 for KuPS at home and 2.46 for Craiova on the road. In the data window the model used, KuPS have scored 16 and conceded 10 in their home sample, while Craiova have scored 13 and conceded 17 away from home. That negative away goal difference for the Romanian side is doing a lot of work in this projection.

Goals: the model is leaning hard

This is where the fixture gets interesting. The over/under ladder came back with ratios of 1.00 at over 0.5, 1.01 at over 1.5, 1.04 at over 2.5, 1.12 at over 3.5 and 1.28 at over 4.5.

Converted into implied probabilities, that is roughly 96% for over 2.5 goals, 89% for over 3.5 and 78% for over 4.5. Those are unusually aggressive outputs. Worth being upfront about that: the model is projecting a high-volume game, and figures at that end of the scale are more sensitive to the sample size behind them than mid-range figures are. Treat the ordering of the ladder as the useful signal rather than the exact decimal.

Team scoring probabilities

The model breaks each side's scoring down individually.

Market Model probability KuPS to score 98.35% KuPS 2+ goals 91.50% Craiova to score 91.92% Craiova 2+ goals 70.37% KuPS fail to score 1.65% Craiova fail to score 8.08%

Both teams to score comes out at 84.27%.

For context, external data on both clubs supports a game with goals in it, though not at quite this intensity. Public figures put KuPS at around 61% of matches with both teams scoring and an average of about 2.72 total goals per game, with Craiova nearer 43% BTTS and about 2.45 goals per match. I would suggest verifying those from a primary stats source before quoting them, as they move week to week.

So the model and the raw form data agree on direction and disagree on magnitude. The model sees a considerably more open game than the season averages alone would suggest.

What the numbers are actually saying

Strip out the decimals and the story is straightforward.

KuPS at home have been productive and reasonably solid. Craiova on the road have leaked more than they have scored in the sample used. Put those two profiles together in a one-off first leg and you get a projection that favours the hosts, expects goals at both ends, and squeezes the draw down to a small share.

The tactical context is worth holding alongside the model. Craiova are a first-leg away side in a two-legged tie, which historically pulls teams towards caution. Models built on league-form data do not always capture that shift in approach. If Craiova set up to protect the tie and take it back to Romania at 0-0 or 1-1, the high-goals projection is the first thing to come under pressure.

There is also the squad note that KuPS include Tommi Jyry, a midfielder who joined this summer from Petrolul Ploiești and knows Romanian football well. Small detail, but a familiar opponent on the other side is rarely irrelevant in a tie this tight.

The honest caveat

Our software calculates probabilities from historical and current performance data. It does not know about a late injury, a red card in the ninth minute, or a manager deciding to park the bus in Kuopio. Every figure above is a probability, not a promise. A 63.97% projection means the model expects that outcome roughly two times in three across many identical situations, which also means it expects the alternative one time in three.

If you want to run fixtures like this yourself, our correct score, over/under and BTTS tools are available as Excel-based software on the site. You put the numbers in, the model does the calculation, and you make your own call on what it means.

18+. Gambling can be addictive. Please play responsibly. For free, confidential advice visit BeGambleAware.org. All outputs shown are statistical model probabilities and are not guarantees of any result.

JSON-LD (single line, paste into whichever field you use for structured data)

← Back to news