How Our Football Prediction Software Works and How to Get Predictions in Minutes
A plain English guide to what our Excel based football prediction tools actually do, what the numbers mean, and how to go from download to your first set of model probabilities in a few minutes.

How Our Football Prediction Software Works and How to Get Predictions in Minutes
If you have ever looked at a fixture list and wondered how anyone turns raw results into a considered view of what might happen next, this guide is for you. Below is a plain English explanation of what our football prediction software does, what the outputs mean, and how to get your first set of numbers on screen quickly.
One thing to be clear about from the start. These tools produce model probabilities, not certainties and not tips. Football is unpredictable by nature. The point of a statistical model is to give you a structured, consistent way of looking at a match instead of relying on gut feeling.
What the software actually is
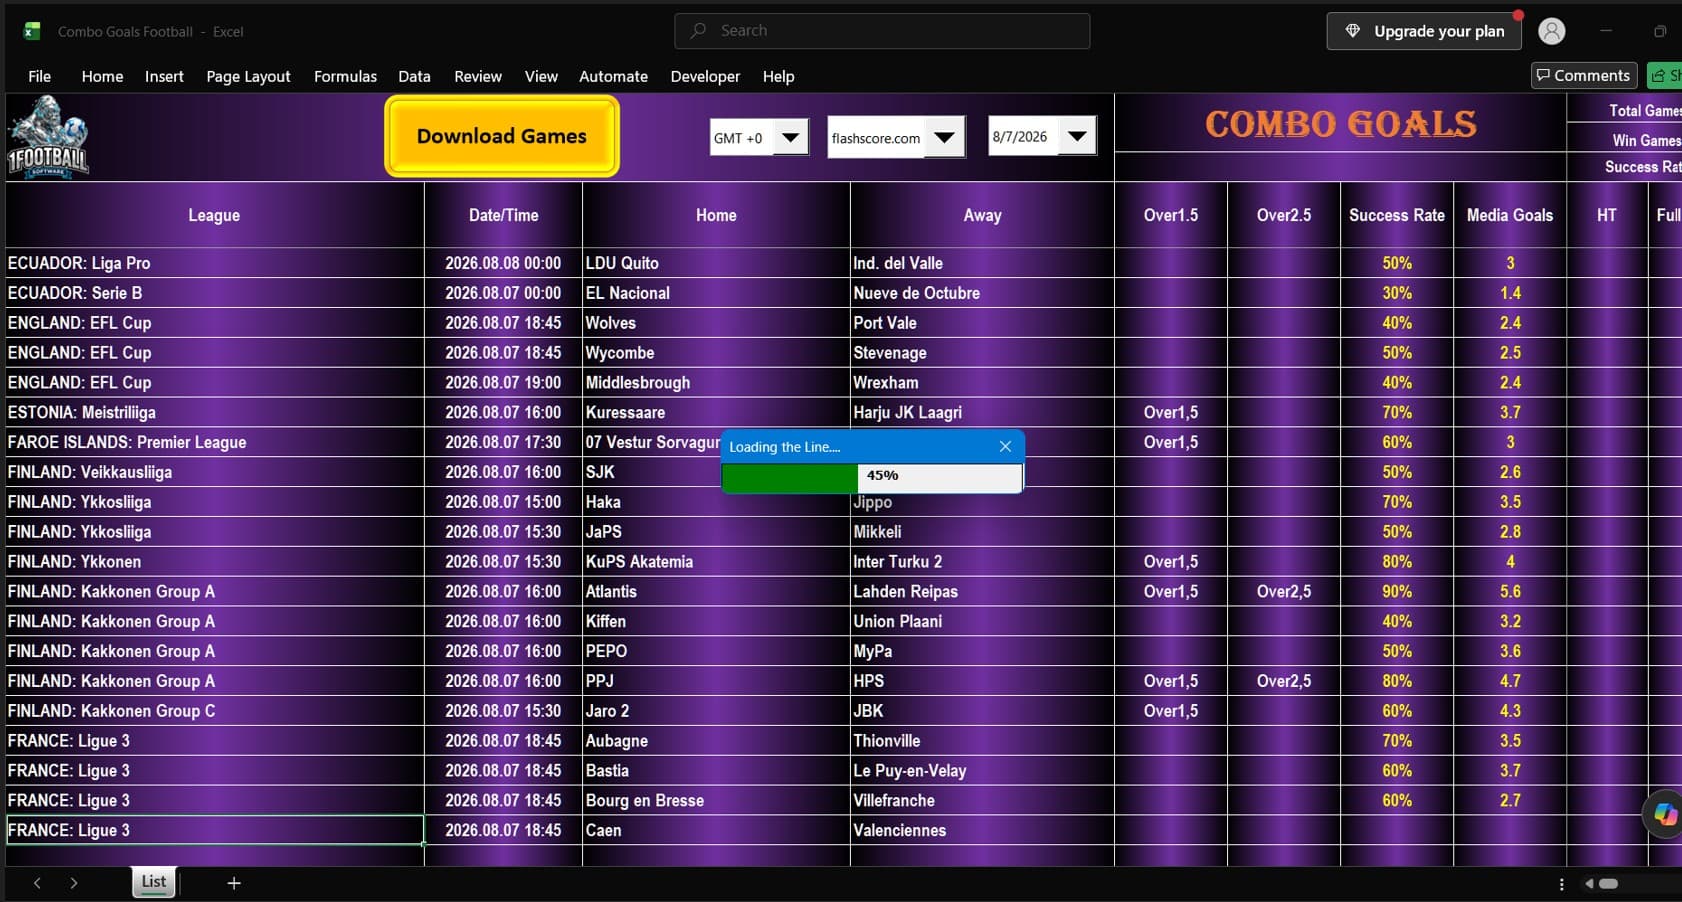
Every tool in our range is a Windows compatible Excel workbook. There is no subscription portal to log into, no app to install, and nothing running in the background on your machine. You download the file, open it in Excel, and work inside it.
That design is deliberate. Excel is transparent. You can see the inputs, you can see the outputs, and you are not asked to trust a black box you cannot inspect.
How the models work
The underlying approach is the same across the range, even though each tool targets a different market.
You supply the match data. Team form, goals scored, goals conceded, home and away splits, and the other fields the workbook asks for. The workbook applies its statistical model. Most of our goals based tools build on Poisson style distributions, which are a long established way of estimating how likely each possible scoreline is given two attacking and defensive strength estimates. You get a probability distribution back. Not a single answer, but a spread of outcomes with a likelihood attached to each one.
So instead of "this match will finish 2-1", you get something closer to "the model rates 1-1 at roughly 12 percent, 2-1 at roughly 9 percent, 1-0 at roughly 8 percent" and so on across the full grid of scorelines.
That distinction matters. A 12 percent outcome is the most likely single result in that example, and it still fails to happen almost nine times out of ten.
The range of tools
Different markets need different models, which is why the range is split rather than sold as one giant workbook.
Correct Score builds the full scoreline grid and ranks each result by model probability. Goals and Over/Under estimates total goals in a match and the probability of crossing common thresholds. Both Teams To Score (BTTS) focuses on the likelihood of each side scoring at least once. Half Time / Full Time splits the match into two phases and models the outcome of each. Combo markets combine two or more of the above into a single view, for people who look at multi part markets. Tennis applies the same probability first thinking to a very different sport, with its own point and set structure.
Most people start with one tool that matches the market they already follow, then add others over time.
Getting your first predictions in a few minutes
Here is the fastest route from checkout to numbers on screen.
Step 1. Download and unzip. After purchase you receive a download link by email. The file arrives as a zip. Extract it to a folder you will remember, such as Documents, rather than opening it directly from inside the zip.
Step 2. Open in Excel and enable content. Windows flags files downloaded from the internet. If you see a yellow security bar across the top of Excel, click Enable Editing so the workbook calculates properly. Some tools also need Enable Content for their calculations to run.
Step 3. Find the input sheet. Every workbook has a clearly labelled input area. Coloured cells are for you to fill in. Uncoloured cells contain formulas and should be left alone.
Step 4. Enter the match data. Pull the numbers from any reliable stats source you already use. Start with a league you know well. The model is only ever as good as the data you feed it.
Step 5. Read the output. Results update as you type. You will see probabilities across the outcomes the tool covers, usually sorted from most to least likely.
Most users are through all five steps inside ten minutes on their first match, and under two minutes on every match after that once the process is familiar.
Getting more out of the tools
A few habits that tend to help.
Save a clean master copy. Before you start editing, duplicate the original file. If a formula gets overwritten by accident, you have somewhere to fall back to.
Work in one league at a time. Team strength numbers are only comparable within the same competition. Mixing leagues in one sheet distorts the comparison.
Use a consistent data window. Whether you use the last six matches or the full season, pick one approach and stick with it. Switching between them makes your outputs inconsistent from week to week.
Compare, do not obsess. The value of a model is in ranking matches against each other and spotting where your own instinct disagrees with the numbers. That gap is the interesting part.
Keep a record. Log what the model said and what actually happened. Over a decent sample you will learn far more about how the tool behaves than any single week can tell you.
What the software will not do
Being honest about limits is more useful than overselling.
It will not tell you what is going to happen. It will not account for information the data does not contain, such as a late injury, a manager resting players before a cup tie, or unusual weather. It does not guarantee any outcome, and no statistical model can.
What it does is give you a repeatable, consistent framework for thinking about a fixture, based on what the historical numbers suggest.
Getting started
If you are new to the range, pick the tool that covers the market you already pay attention to. You will get more from a single tool you understand well than from several you have not properly explored.
Browse the full range on the shop page, and if you are unsure which one suits how you follow football, get in touch and describe what you look at on a normal matchday.
All outputs from our software are statistical model probabilities based on the data entered by the user. They are not predictions of certainty, guarantees of any outcome, or betting tips. Past performance of any model does not indicate future results.
18+. Please gamble responsibly. For free, confidential advice and support visit BeGambleAware.org.