Europa League Correct Score Predictions
Quick Answer
Learn how to read Europa League correct-score predictions, compare software probabilities and review results using an original PSV–Club Brugge example.
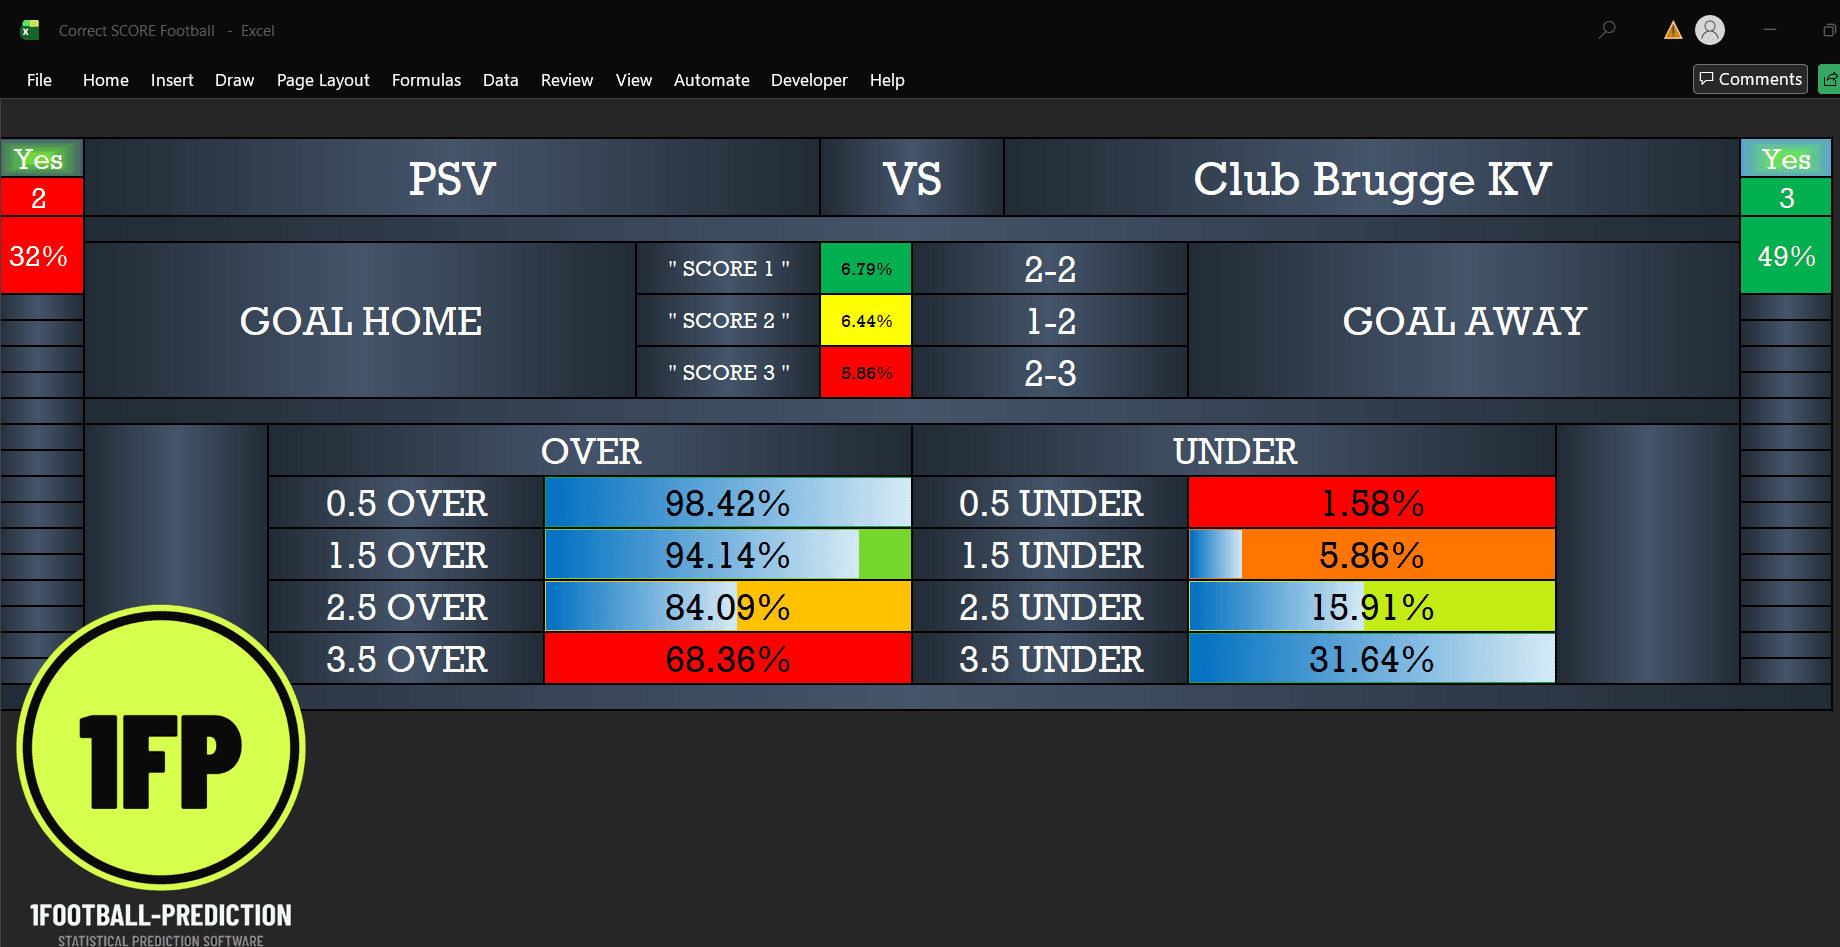
Original software example from PSV–Club Brugge, a Champions League fixture. Scores are shown home team first.
To get correct-score football predictions for Europa League matches, first check that the fixture is available in your software and that the competition, date and home team are correct. Then compare the score estimates with the wider goals forecast before deciding how to interpret the report.
Correct Score Football Software displays three score scenarios alongside their estimated probabilities. Understanding the difference between those individual scores and the broader goals markets is essential. The original PSV–Club Brugge images below show how to read that information and review the result afterwards.
How to find and review a Europa League fixture
Start with the official fixture list, then locate the same match in the software’s available games. Check the home and away order carefully. A prediction of 1–2 means one goal for the home team and two for the visitors. UEFA Europa League fixtures and results
- Confirm the fixture. Match the teams, competition and date before opening the analysis.
- Read all three score estimates. Record their percentages and order.
- Compare the goals forecast. Check whether the suggested scores fit the over/under estimates.
- Save the report before kick-off. Keep a timestamped copy so the original forecast can be reviewed later.
- Record the outcome consistently. Track the first-listed score separately from matches where another shortlisted score occurs.
Availability depends on the fixtures supplied to the software. Check coverage for the match you want to analyse.
Reading the original software example
The supplied worksheet shows PSV at home against Club Brugge KV. UEFA lists this fixture in the Champions League. It provides a worked example of the same score-reading process that readers can apply when reviewing an available Europa League fixture. UEFA match listing
| Position in the report | Score estimate | Displayed probability |
|---|---|---|
| First | PSV 2–2 Club Brugge | 6.79% |
| Second | PSV 1–2 Club Brugge | 6.44% |
| Third | PSV 2–3 Club Brugge | 5.86% |
The leading individual score is 2–2, with 1–2 close behind. These three estimates total 19.09%, leaving most of the probability outside the displayed shortlist.
A score appearing first means it ranks above the other displayed scores. Even the leading estimate here is below 7%, which leaves substantial uncertainty around the exact outcome.
Original software recording
The supplied recording accompanies this software example. Open it full-screen to read the workbook.
How the goals forecast adds context
| Goal total | Over | Under |
|---|---|---|
| 0.5 | 98.42% | 1.58% |
| 1.5 | 94.14% | 5.86% |
| 2.5 | 84.09% | 15.91% |
| 3.5 | 68.36% | 31.64% |
All three shortlisted scores contain at least three goals, so they fit the report’s preference for over 2.5.
The distinction becomes clearer at over 3.5. Both 2–2 and 2–3 qualify, while 1–2 finishes with exactly three goals. A successful 1–2 score selection would therefore accompany an unsuccessful over 3.5 selection.
That is why each market needs its own result record. Several figures on one report can point towards a high-scoring match while producing different outcomes.
What the supplied result graphic shows
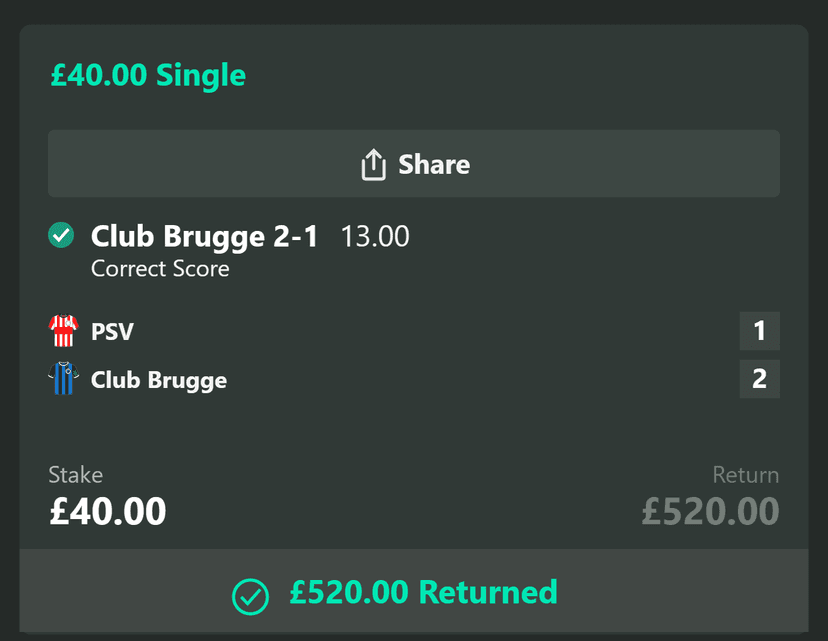
The owner-supplied graphic shows PSV 1–2 Club Brugge and a selection marked successful. The transaction and payment have not been independently verified.
The displayed 1–2 result matches the software’s second-listed score, which carried a 6.44% estimate. The first-listed 2–2 and third-listed 2–3 do not match the graphic.
The graphic uses “Club Brugge 2–1” to describe the away team’s winning score. Its team rows show PSV 1 and Club Brugge 2, which matches the software’s home-first notation of 1–2.
It also displays a £40 stake at decimal odds of 13.00. Multiplying those figures gives the shown £520 gross return, including the stake. These amounts describe this supplied example and should not be treated as an expected return from using the software.
One matching score cannot establish an overall success rate. That requires a complete record of predictions, including unsuccessful selections, over a defined period.
Choosing correct-score software
Correct Score Football Software is designed for Windows and Microsoft Excel. Its product page describes three score scenarios, over/under goals estimates, match-result estimates and both-teams-to-score analysis, with automatic daily updates and 12 months of access.
This makes it relevant for readers who want to compare several possible outcomes in one worksheet. Before purchasing, check the current requirements and whether the fixtures you want are covered. Correct Score Football Software details
Reviewing your Europa League predictions
Keep a record containing the match, forecast time, three suggested scores, their percentages and the result. Decide in advance whether you are evaluating the first score, the full shortlist or a goals market.
For the supplied example, the accurate description is straightforward: the second-listed 1–2 score matched the result graphic. Applying that same standard to every match gives you a more useful record of the software’s performance.
This guide uses original images supplied by the store owner. Predictions are estimates and can be wrong. 18+.