
How to Read Daily HT/FT Football Predictions
Quick Answer
Compare Porto–Napoli and Viking–Sabah to see how a 1–1 half-time score affects HT/FT predictions, first-half goal totals and the final result you still need.
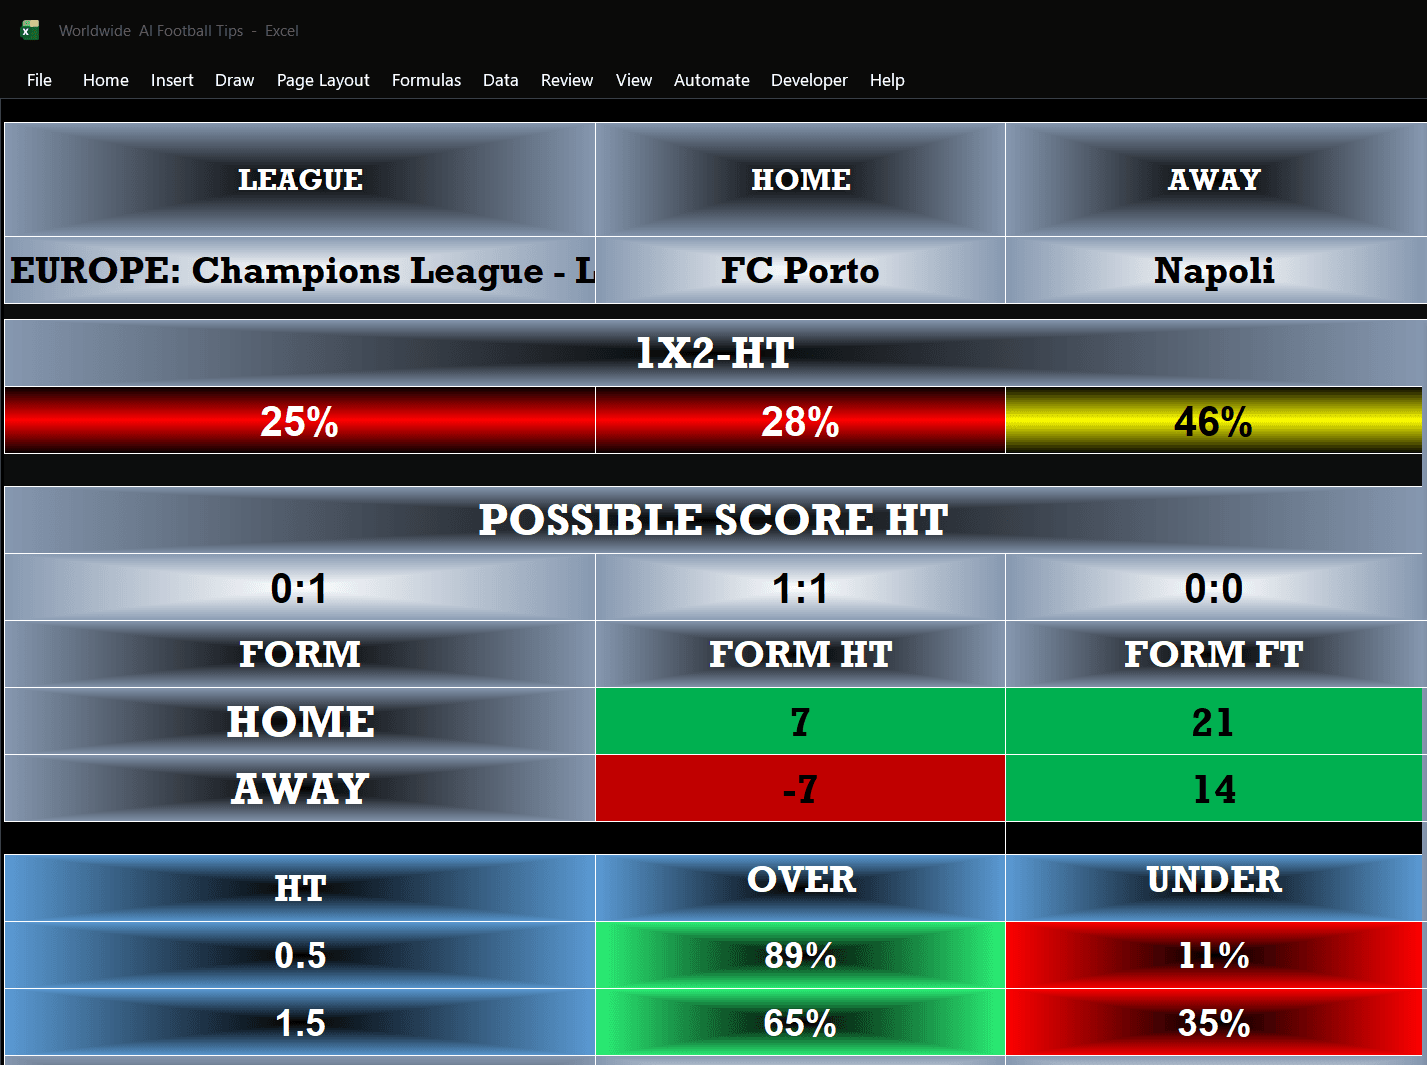
Original Worldwide AI Football Tips worksheet for FC Porto vs Napoli.
Can a football forecast get the first-half goals right and still miss the half-time leader? The Viking–Sabah example shows how. The software gave Viking a 63% chance of leading at half-time and an 84% chance of at least two first-half goals. The supplied result graphic shows 1–1. Two goals arrived, but neither side led.
That distinction matters when using HT/FT football predictions software. HT means half-time and FT means full-time. A combined HT/FT prediction asks who leads at both whistles. For example, X/1 means a draw at half-time followed by a home win at full-time. The two original software reports below show half-time forecasts and full-time form figures. The result graphic lets us review the first-half goals selections. A full HT/FT review would also need the final scores.
How to read a daily HT/FT report
Start with the row labelled 1X2-HT. Read it from left to right: 1 is a home lead at half-time, X is a draw, and 2 is an away lead. Then move to the HT Over/Under table. Here, over 1.5 means the teams score at least twice between kick-off and the half-time whistle. A 2–0 lead and a 1–1 draw both qualify.
The Possible Score HT row gives examples of exact scores. Keep those separate from the percentages above them. If the home-lead estimate is 63%, that figure covers every possible home lead. It cannot be assigned to a single score such as 2–1.
What a 1–1 half-time score leaves open
Suppose Porto and Napoli reach the break at 1–1. The first letter of the HT/FT result is now X. If Porto then win 2–1, the combination is X/1. If the score stays 1–1, it is X/X. If Napoli win 1–2, it is X/2. All three scenarios have exactly two first-half goals. The two goals settle the first-half total, while the second half decides which HT/FT combination applies. These full-time scores are illustrations. The supplied result graphic records only the first-half selections.
FC Porto vs Napoli — first-half goals or an away lead?
The Worldwide AI Football Tips worksheet puts Napoli ahead of the other half-time outcomes at 46%, followed by a draw at 28% and a Porto lead at 25%. The displayed figures total 99%. Napoli have the largest individual share, although their estimate is still below half.
The possible half-time scores are 0–1, 1–1 and 0–0, with Porto’s score first. Only 1–1 reaches the two-goal threshold. Yet the goals table gives 65% for over 1.5. Counting how many of the three score suggestions qualify would miss other possibilities, such as 2–0 or 0–2. For a question about total goals, use the goals row directly.
Viking vs Sabah — a stronger estimate for two goals
Viking’s report gives the home side 63% to lead at the break, against 19% for a draw and 17% for a Sabah lead. Its three possible half-time scores are 2–1, 2–0 and 1–1. All three reach over 1.5 goals, but only the first two put Viking ahead.
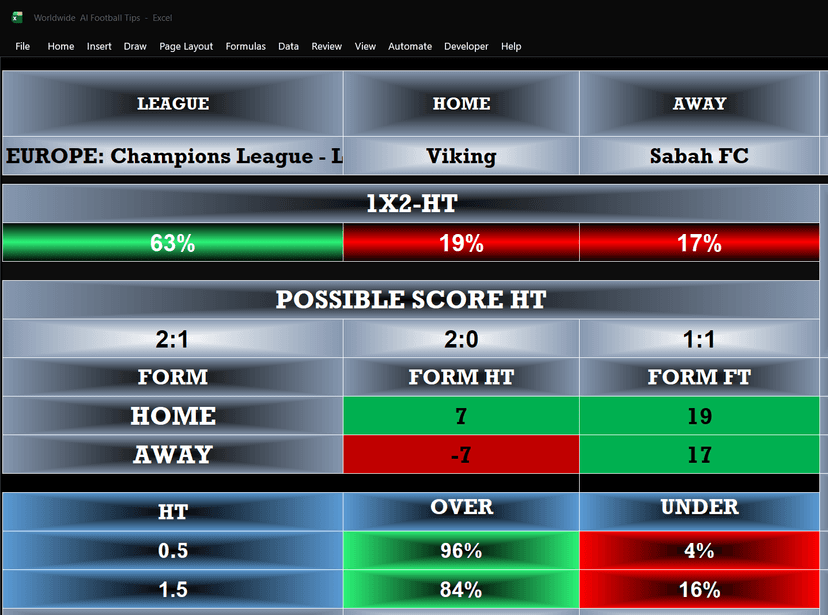
For someone comparing the day’s fixtures, the clearest difference is in the same market across both reports. Viking–Sabah’s 84% estimate for two or more first-half goals is 19 percentage points higher than Porto–Napoli’s 65%. Both percentages are software estimates for those fixtures. A longer record is needed to judge how closely those estimates track actual results.
What the first-half double shows
The supplied graphic labels both selections “Over 1.5 — 1st Half Goals” and shows 1–1 beside each fixture. On those displayed scores, both matches reached the threshold exactly. One fewer goal in either first half would have changed the outcome of the double.
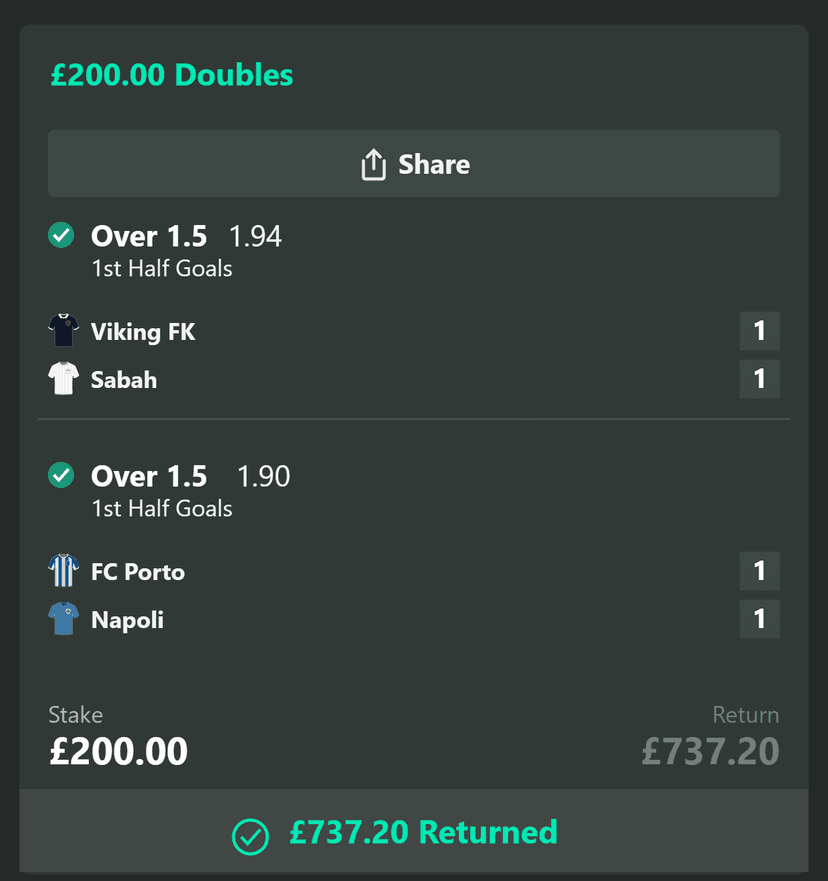
The graphic displays a £200 stake at decimal odds of 1.94 and 1.90, with £737.20 returned including the stake. These figures describe the supplied example. The images do not establish when the forecasts were recorded or independently verify the payment.
How to track HT and FT predictions each day
Before kick-off, save the fixture, the forecast time, the exact market and its displayed percentage. At half-time, enter the score and grade the half-time leader and goals total separately. If you also recorded a combined HT/FT selection, leave that entry open until you have the full-time result. The worksheet’s Form FT column is a form indicator, so copying its number into the result field would mix two different measures.
For these examples, a fair record would show two matches displayed at 1–1, both meeting the first-half goals threshold. It would also show that the leading half-time result estimate in each report was a team lead. Keeping both observations gives readers a clearer view of how the software performed than recording the winning double alone.