How to Get Daily Correct Score From AI Software
Quick Answer
Learn a daily correct-score software routine with original Beşiktaş–Kocaelispor and Germany–Serbia images, ranked forecasts and clear result comparisons.
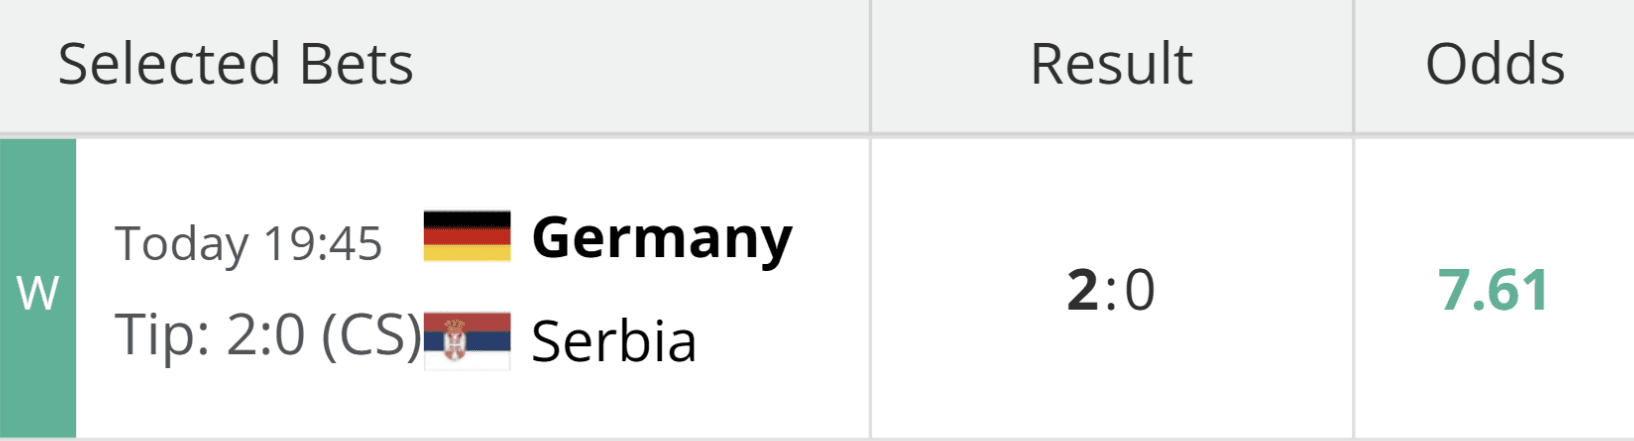
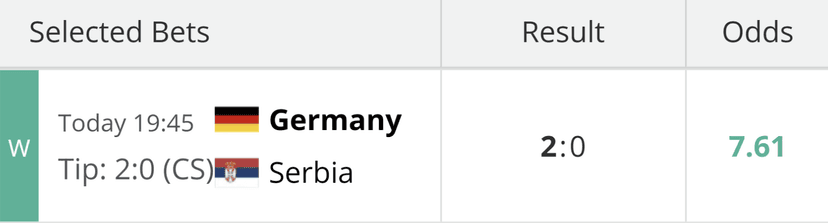
Original supplied Germany–Serbia result screenshot. One example does not establish software accuracy.
To get daily correct-score predictions from AI software, check that the tool supports your device, open its current fixture list and select the match you want to review. Compare the ranked scores and their probabilities, then save the output before kick-off so you can assess it against the result later.
New example: Beşiktaş vs Kocaelispor
Added 12 October 2026: The supplied software screen lists 2–1 first at 7.94%, matching the 2–1 shown on the accompanying result card. Both original images are included below. The earlier Germany–Serbia example and recording remain in this guide.
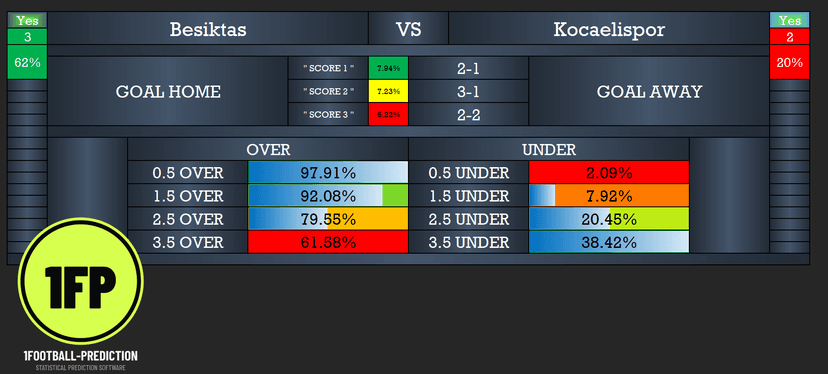
Original software screenshot supplied by 1Football Prediction, reproduced unchanged. The percentages are displayed model estimates.
The software screen lists these possibilities:
| Position | Correct score | Displayed estimate |
|---|---|---|
| Score 1 | Beşiktaş 2–1 Kocaelispor | 7.94% |
| Score 2 | Beşiktaş 3–1 Kocaelispor | 7.23% |
| Score 3 | Beşiktaş 2–2 Kocaelispor | 6.22% |
The leading 2–1 forecast is only 0.71 percentage points ahead of 3–1. Read that difference alongside the ranking: first place does not imply a large advantage over the next score.
Together, the three displayed estimates total 21.39%. They are a shortlist of possible scores, not a complete picture of every result the match could produce. The 7.94% beside 2–1 describes that exact score; it is not the software’s overall accuracy or Beşiktaş’s full chance of winning.
Read the goals estimates separately
The same screenshot shows over 2.5 goals at 79.55% and over 3.5 goals at 61.58%. These markets cover groups of scorelines, which explains why their percentages can be much higher than the probability of one exact score.
A 2–1 score contains three goals. It fits over 2.5, but falls under 3.5. A 3–1 or 2–2 score contains four goals and fits both overs.
You can use the goals table to understand the wider forecast, but keep its outcome separate from the correct-score result when reviewing performance.
Save the output before kick-off
Keep a screenshot showing the fixture, forecast and capture time. Write down whether you are assessing the first score only or checking for a match anywhere in the three-score shortlist. Decide that before the result is known.
If the software later changes its estimates, retain the earlier version as well. That makes it possible to compare the actual forecast you reviewed with the eventual result.
Beşiktaş vs Kocaelispor: comparing the supplied result
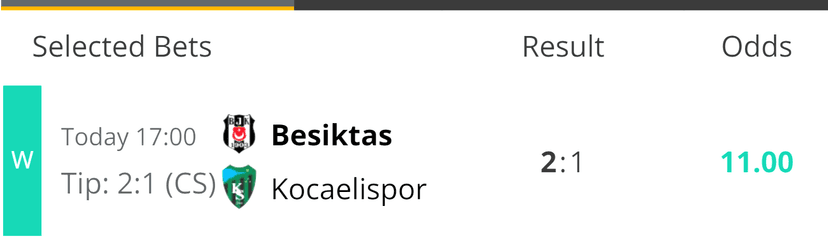
The supplied result card shows “Tip: 2:1 (CS)”, a 2:1 result, odds of 11.00 and a W marker. These are the details visible in the original image.
The 2–1 on the result card matches Score 1 in the software screenshot. The second and third listed scores, 3–1 and 2–2, do not match that displayed result.
The goals comparison is mixed: the card’s three-goal result fits over 2.5, while the software’s higher-probability over 3.5 outcome does not occur. Showing both sides gives a more useful view of the output than presenting the matching score alone.
The card displays odds of 11.00, but no stake or payout. Those odds are part of the supplied image, not a current price offer or proof of a cash return.
Neither image establishes when the prediction was first generated. The result card says “Today” without a full date, so this is a comparison of supplied software and result images, rather than an independently dated match report or a verified pre-match betting record. One matching example does not establish long-term accuracy or profit.
Earlier example and daily software guide
Daily correct-score predictions begin with a simple question: which exact scorelines does the software consider plausible for a fixture? A useful tool makes those possibilities easier to compare. The important next step is understanding what its output means before treating any selection as a betting decision.
This guide brings together an original result screenshot supplied for this article, a software image from our product gallery and a practical daily review process. The focus is on reading and recording forecasts consistently.
THE SUPPLIED EXAMPLE
Germany–Serbia:
a displayed 2–0 result
The supplied screenshot lists Germany against Serbia, a correct-score tip of 2:0, a result of 2:0 and decimal odds of 7.61. Its green “W” indicator marks the selection as a win within that display.
The image does not identify a full fixture date, competition, age category or source. It is therefore presented as a screenshot example, not an independently verified match report or proof that the selection was recorded before kick-off.
What daily correct-score software gives you
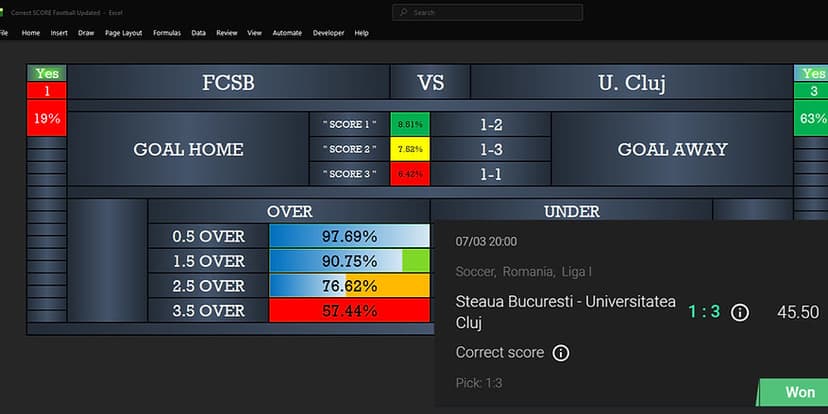
Our Correct Score Football Software runs on Windows with Microsoft Excel. The product listing describes three scoreline predictions per match, with supporting goals, match-winner and both-teams-to-score information. One payment includes 12 months of access.
These outputs help organise a match review. A ranked scoreline is still an estimate: being the most likely individual score does not mean it is more likely than every other score combined. Likewise, an over-goals estimate describes a group of possible results, not one exact outcome.
BUILD A REPEATABLE ROUTINE
Four steps for a better daily review
Confirm the fixture
Check the teams, competition, match date and kick-off timezone. Similar team names and youth fixtures can make screenshots easy to misread.
Review the whole output
Compare the ranked scores with the supporting markets. Record the software version and refresh time so you know which output you evaluated.
Save the selection first
Keep a timestamped record before kick-off. Decide whether you are evaluating the first-ranked score or several separate selections, and apply that rule consistently.
Record every outcome
Include wins, losses and skipped fixtures. A collection of selected winning screenshots cannot establish an overall strike rate or profitability.
Read odds separately from model confidence
The 7.61 figure in the supplied image is a displayed decimal price, not a software accuracy percentage. Its simple break-even probability is approximately 13.14% (1 ÷ 7.61). That calculation does not establish the true chance of the scoreline or demonstrate a profitable bet. The screenshot supplies no independently assessed probability to compare against that threshold.
Original recording
The accompanying recording is included below as supplied, so readers can inspect the source material alongside the screenshot.
Paid software and the free website model
The paid Excel software and the free website prediction model are separate products. Results in the website’s public track record should not be presented as evidence of the paid software’s accuracy.
For another worked example, read our Spain U20–Mexico U20 correct-score article. To explore the numbers in more detail, see the guide to reading a ranked score table.
EXPLORE THE SOFTWARE
See the interface.
Check the requirements.
Review the product screenshots, supported markets and access details before choosing your software.
Explore Correct Score Software ↗Predictions are estimates, not guarantees. No software can promise a correct score or profit. 18+ only. Never stake money you cannot afford to lose. Responsible-gambling support.